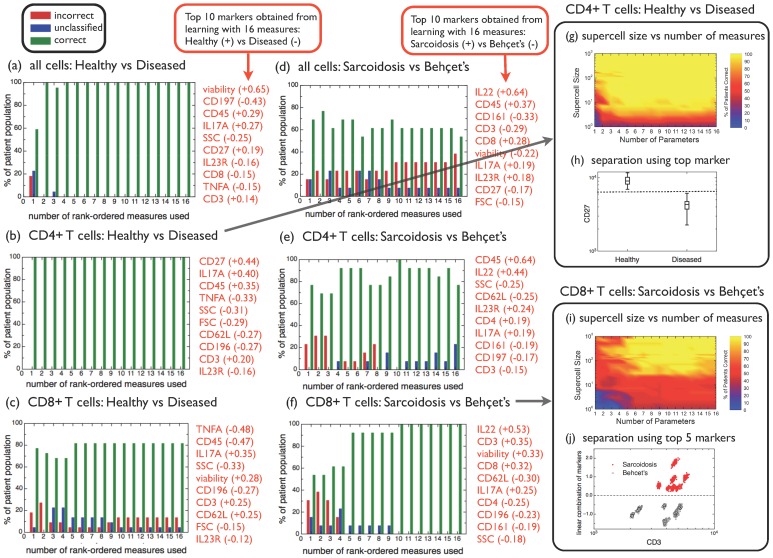
Figure 3. Predictive power of automated phenotyping to distinguish healthy vs diseased, or sarcoidosis vs Behçet's for different cell types and number of markers measured.
(a)–(f) A jackknife analysis of patient classification was carried out based on a sample with 100 supercells, where each supercell was obtained from averages over 500 randomly chosen cells. The percentage of patients correctly classified is shown as green bars, the percentage of patients for which a classification is not possible (because less than 95% of supercells fall into either one of the classes) is shown as blue bars, while the percentage of patients incorrectly classified is shown as red bars. The top 10 measures for each case are listed to the right of each plot. Separate analyses have been carried out for all cells, CD4+ T cells and CD8+ T cells, as indicated, as well as for the two binary classification scenarios “healthy vs diseased”, and “sarcoidosis vs Behçet's”. (g) Percentage of supercells correctly classified as healthy or diseased, as a function of the supercell size and the number of measures used, within the CD4+ T cell subpopulation. (h) Distribution of the top marker (CD27) for supercells averaged over 500 randomly chosen CD4+ T cells. (i) Percentage of supercells correctly classified as sarcoidosis or Behçet's disease, as a function of the supercell size and the number of measures used, within the CD8+ T cell subpopulation. (j) Linear combination of the top 5 markers IL22, CD3, viability, CD8 and CD62L, as a function of CD3, for supercells averaged over 500 randomly chosen CD8+ T cells.

