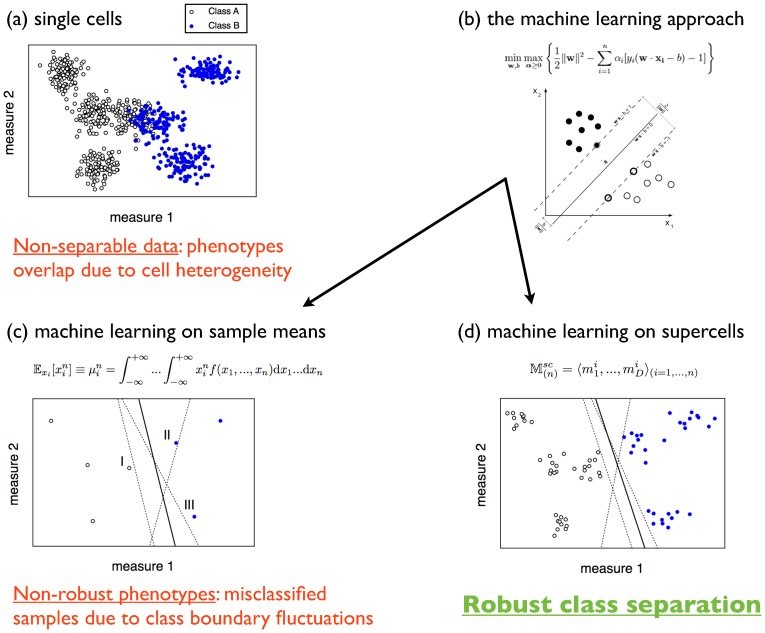
Figure 4. Summary of the supercell approach.
(a) 2D synthetic data representing 7 single-cell patient samples in two categories. Due to cell heterogeneity, different phenotypes overlap and the data are non-separable. (b) A machine learning approach such as support vector machines is able to find the optimal decision boundary between two classes of datapoints. However, this method (and variants thereof) fail when the samples are strongly overlapping, as is the usual case for single-cell datasets (recall Fig. 1A(i)). (c) Sample means or higher-order moments of the cell multivariate distributions generally lead to poor, non-robust phenotypes. The solid line is the class boundary learnt using all datapoints; by removing either of the support vectors that define this boundary (marked by “I”, “II”, and “III”), the boundary changes as indicated by the dashed lines, thus leading to jackknife prediction failures. (d) Representing patient samples by supercell distributions, class separation becomes robust. Removing patient samples “I”, “II”, or “III”, the decision boundary changes as shown by the dashed lines. Departures from the boundary learnt using all patients (solid line) are less significant and do not cause any jackknife failed predictions.

