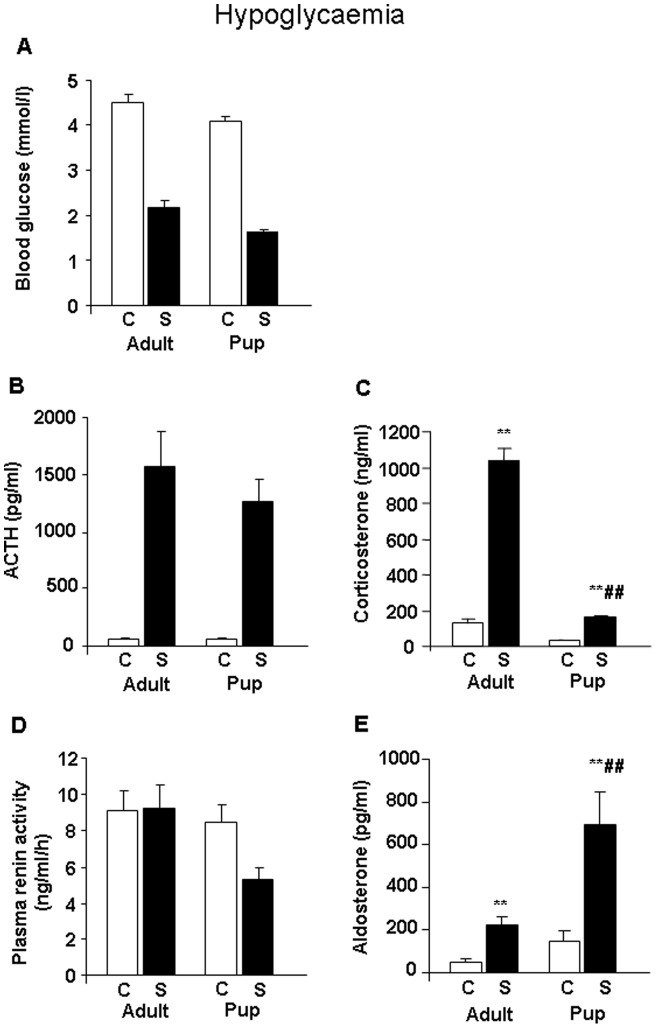
Figure 1. Changes in plasma hormone and glucose concentrations during stress of hypoglycaemia in male Wistar rats (n = 12–16) at 90 minutes after the insulin injection.
A. Blood glucose (mmol/l) – the effect of treatment and age were statistically significant (p<0.01). B. Plasma ACTH (pg/ml) – the effect of treatment was statistically significant (p<0.01). C. Plasma corticosterone (ng/ml) – the effects of age (p<0.01), treatment (p<0.01) and age x treatment (p<0.01) interaction were statistically significant. D. Plasma renin activity (ng/ml/h) – the effect of age (p<0.05) was statistically significant. E. Plasma aldosterone (pg/ml) – the effects of age (p<0.01), treatment (p<0.01) and age × treatment (p<0.05) interaction were statistically significant. Abbreviations: C: control, unstressed; S: stressed; **p<0.01 vs. appropriate control group; ##p<0.01 vs. appropriate adult group.

