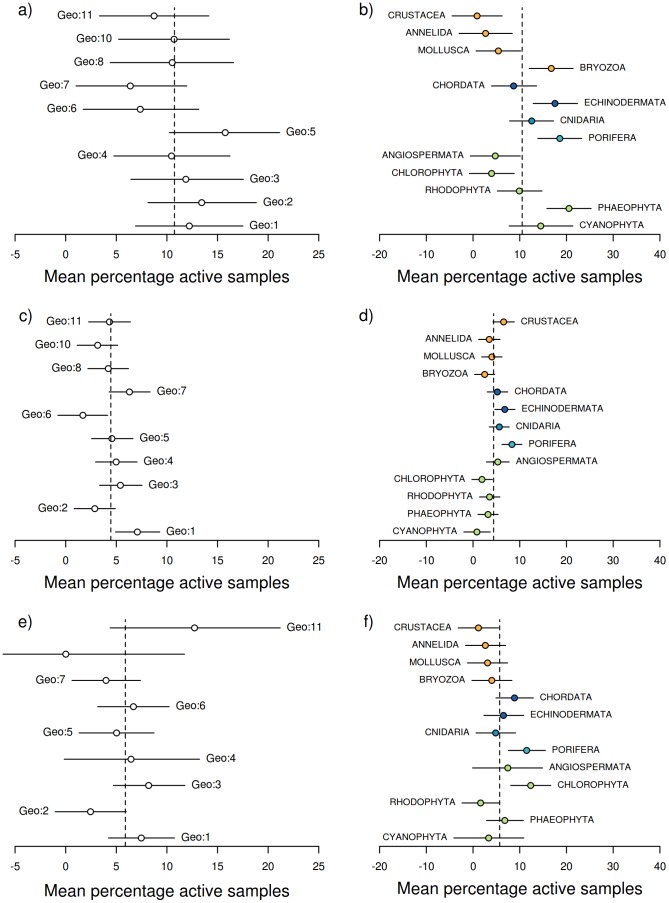
Figure 3. Results of the Bayesian Hierarchical analyses.
Mean (±95% CI) predicted marginal means of percentage of bioassay samples assigned as active (activity score lower than one standard deviation below the mean) according to bioregion and Phyla (respectively), for the three bioassay types: a) and b) Cytotoxicity; c) and d) antimicrobial; and e) and f) CNS Protective. Green, light blue, mid blue, dark blue and orange symbols represent plant/algae; Early-Metazoan, Early-Eumetazoan, Deuterostome and non-Deuterostome lineages respectively. This colour scheme is used throughout figures 3–8.

