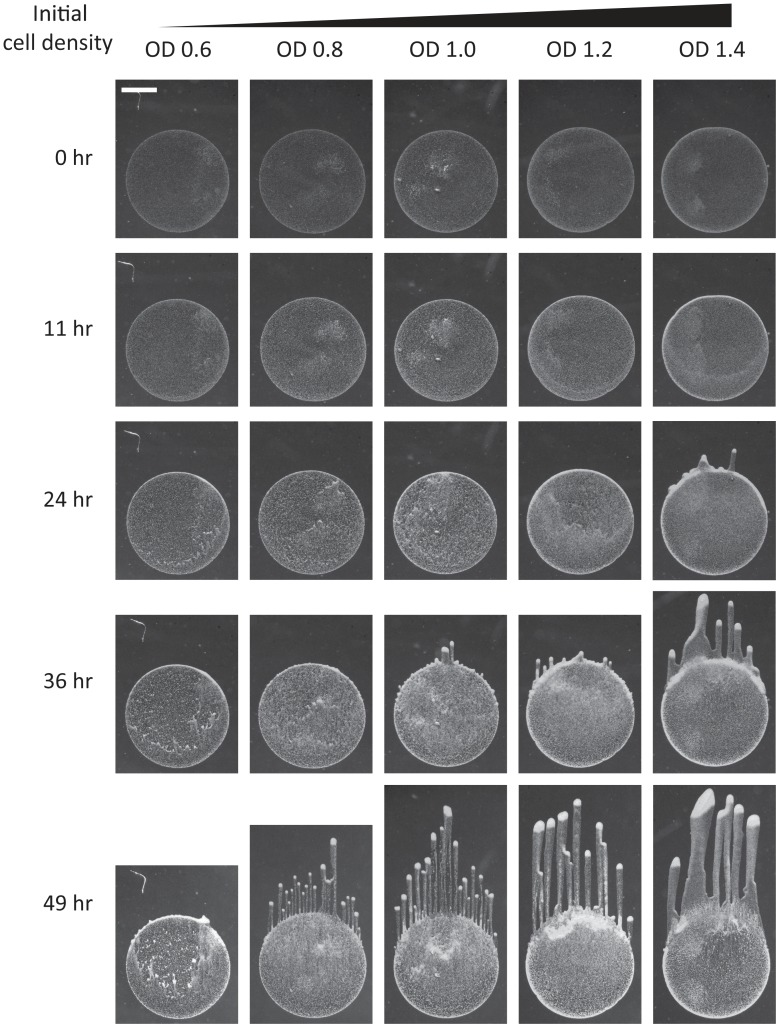
Figure 8. Model successfully predicts effects of increased cellular concentration of finger ramp time and biomass.
Phototaxis time-lapse of Synechocystis cells deposited on an agarose surface with increasing initial concentrations with OD730 (from left to right) of 0.6, 0.8, 1.0, 1.2, and 1.4. Time-lapse images were taken at 0, 11, 24, 36, and 49 hr. The images show a negative correlation between initial cell density and time to finger formation, and a positive correlation between initial cell density and number of cells in each finger, both of which are trends predicted by our biophysical model. Scale bar is 1 mm.

