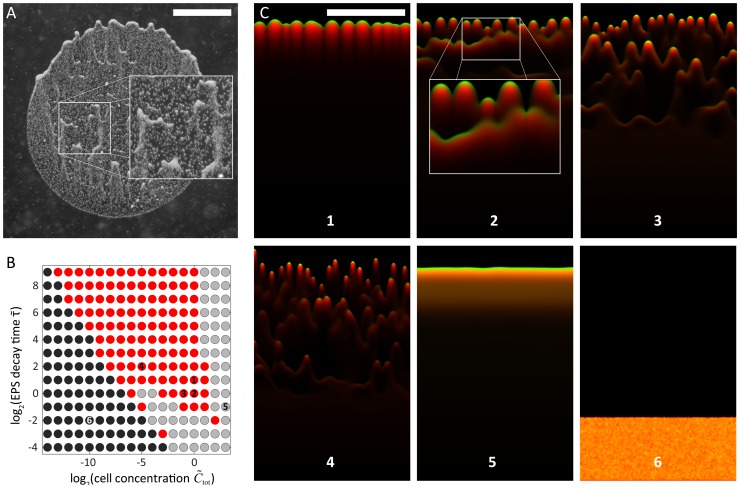
Figure 9. EPS decay results in multiple cell fronts and preferred paths for cellular groups.
A) Experimental example of cells splitting into multiple fronts that head toward the light source. B) Phase diagram of the EPS decay model at a constant bias force. In the red region, cells form discrete, motile groups that head toward the light source in one or more cellular fronts. In the gray region, cells move toward the light source but do not form discrete groups. In the black region, cells are essentially non-motile due to insufficient EPS production and/or rapid decay of EPS. C) Late time-point snapshots of simulations from regions of the phase diagram in (B), with a light source at the top (green, cells; red, EPS; orange, colocalization of cells and EPS). Frames 1–4 depict results from simulations in the red region in (B), in which multiple fronts with finger-like morphologies can form similar to (A) with varying group sizes and numbers of distinct cell fronts. Groups of cells behind the primary front often catch up by following EPS trails left by forward groups (inset of frame 2). Frame 5 is from a simulation in the gray region of (B), in which cells move toward the light but do not form discrete groups. Frame 6 depicts the result from a simulation in the black region of (B); the cells are essentially non-motile. Scale bars are 1 mm.

