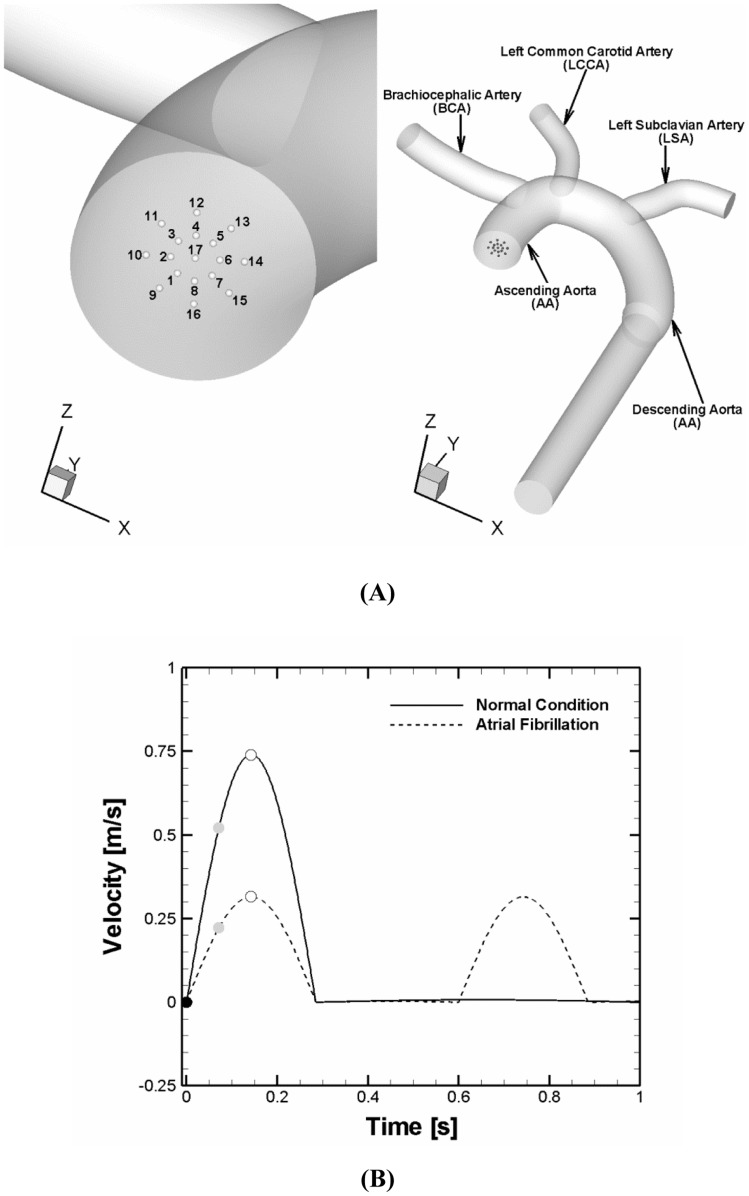
Figure 1. Computational domain and flow conditions for simulations.
(A) Aortic arch model used for simulations and clot release positions at the aortic inlet. The initial positions of a clot were assumed to be circumferentially distributed at a radial distance of 0–40% of aortic radius (position 1 to 17). (B) Normal and AF flow velocity profiles specified at the aortic inlet. Solid and dashed lines represent normal and AF aortic flow conditions, respectively. The velocity profiles reflect the reduction in cardiac output and cycle length. The cardiac output and cycle length corresponding to the normal and AF conditions were 5.5 vs. 3.8 L/min and 1 vs. 0.6s. The black, gray, and white circle symbols denote three different clot ejection moments assumed which correspond to a beginning of systolic, accelerating, and peak stage of the cardiac cycle, respectively.

