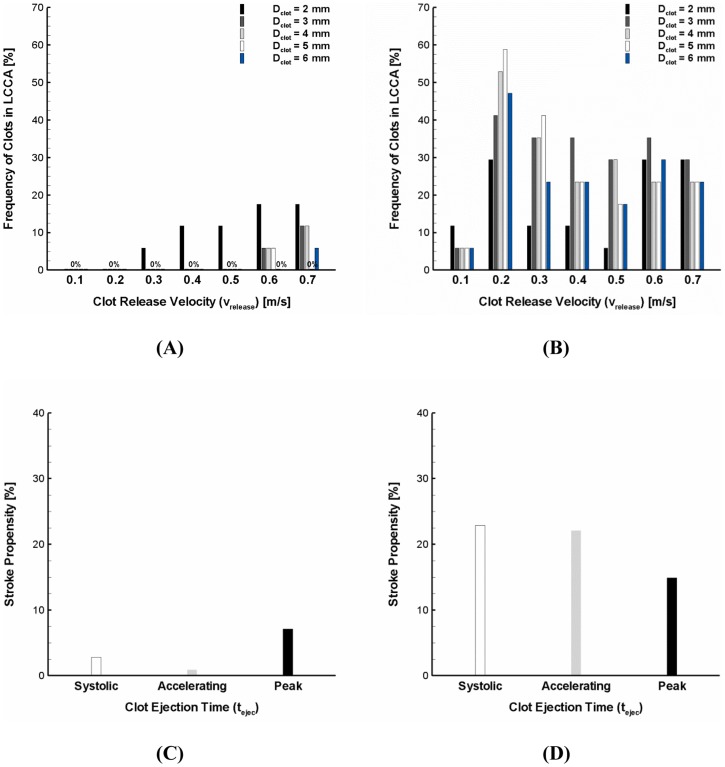
Figure 5. Stroke propensity for the clots of 2–6 mm diameter released at a range of clot ejection speeds (i.e., 0.1–0.7 m/s) under the (A) normal and (B) AF flow conditions.
The black, dark gray, light gray, white, and blue bars represent 2, 3, 4, 5, and 6–6 mm diameter with a range of clot ejection speeds of 0–0.7 m/s released at three different ejection times indicated in Fig. 1B under the (C) normal and (D) AF flow conditions. The white, gray, and black bars denote the clot ejection moment corresponding to the beginning of systolic, accelerating, and peak stage of the cardiac cycle, respectively.

