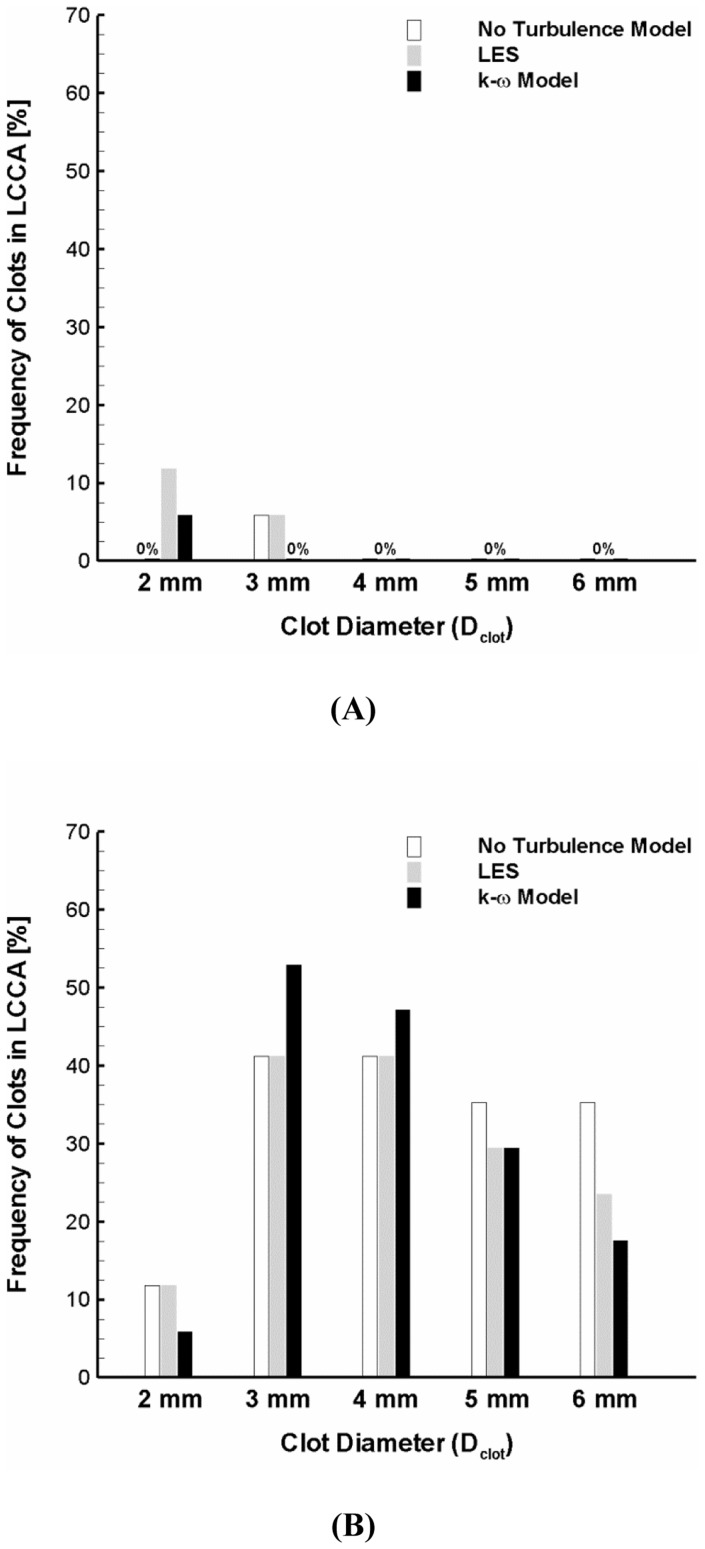
Figure 7. Variation of stroke propensity among three different flow modeling approaches (i.e., no turbulence model, LES, and k-ω SST model) at the high ejection speed for the normal (A) and AF (B) flow conditions.
The white, gray, and black bars represent no turbulence model, LES and k-ω SST model, respectively.

