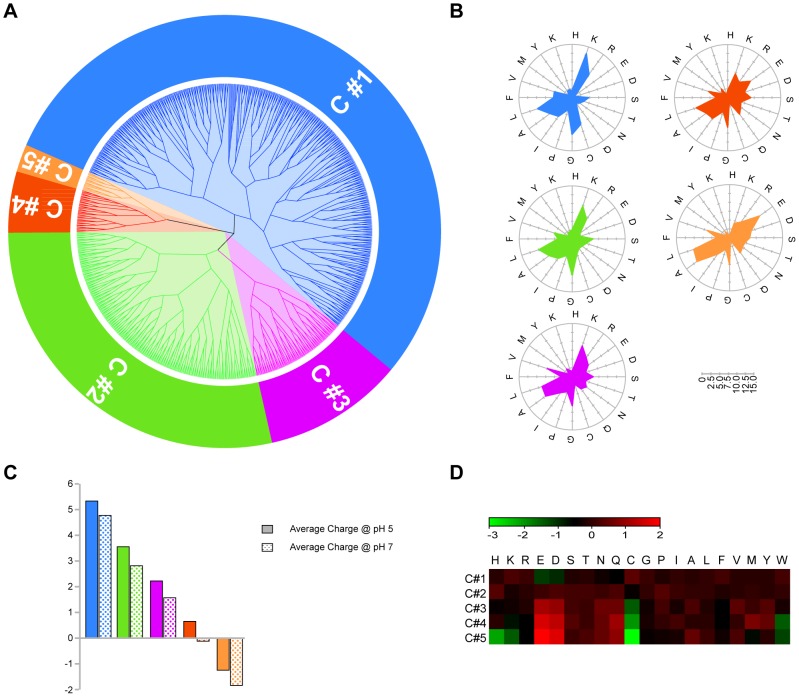
Figure 2. RF proximity cluster analysis.
A) Dendrogram representing the cluster subdivision of AMPs dataset, based on RF proximity values. B) Radar distribution of cluster AA composition (i.e. count of each AA normalized by the total number of AA in the cluster). C) Average net peptide charge of each cluster at different pH conditions. D) Heat map representing relative abundance of each AA, calculated as Log2 of AA composition in the cluster normalized by AA composition of the entire AMP set.

