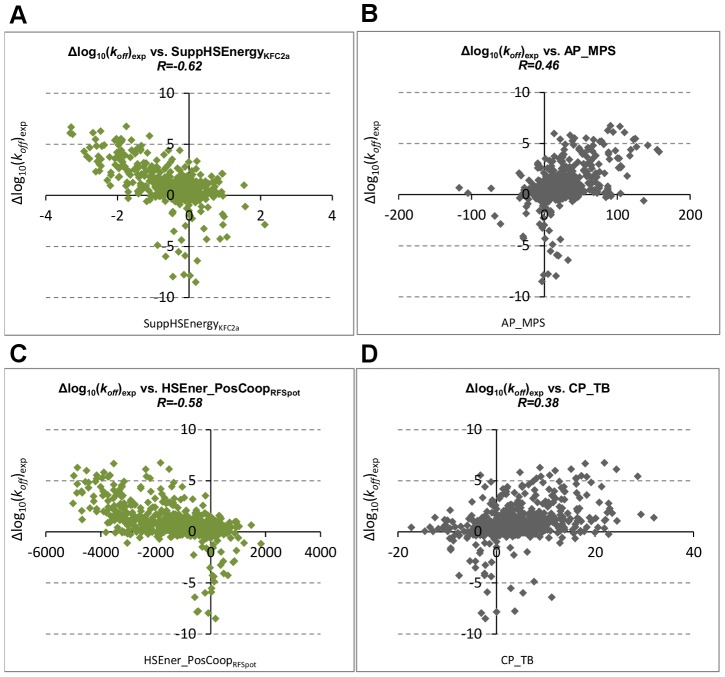
Figure 4. Hotspot and molecular descriptor scatter plots.
The relationship between experimental values for Δlog10(koff) and (A) hotspot descriptors showing highest correlation with Δlog10(koff) (SuppHSEnergyKFC2a - changes in hotspot energies in the support region as predicted by KFC2a [30]), (B) molecular descriptor showing highest correlation with Δlog10(koff) (AP_MPS - the DARS atomic potential [54]), (C) top performing hotspot descriptor for the detection of stabilizing mutants (HSEner_PosCoopRFSpot – changes in hotspot energies on accounting for positive cooperativity in hotregions) and (D) top performing molecular descriptor for the detection of stabilizing mutants (CP_TB – coarse grained protein-protein docking potential).

