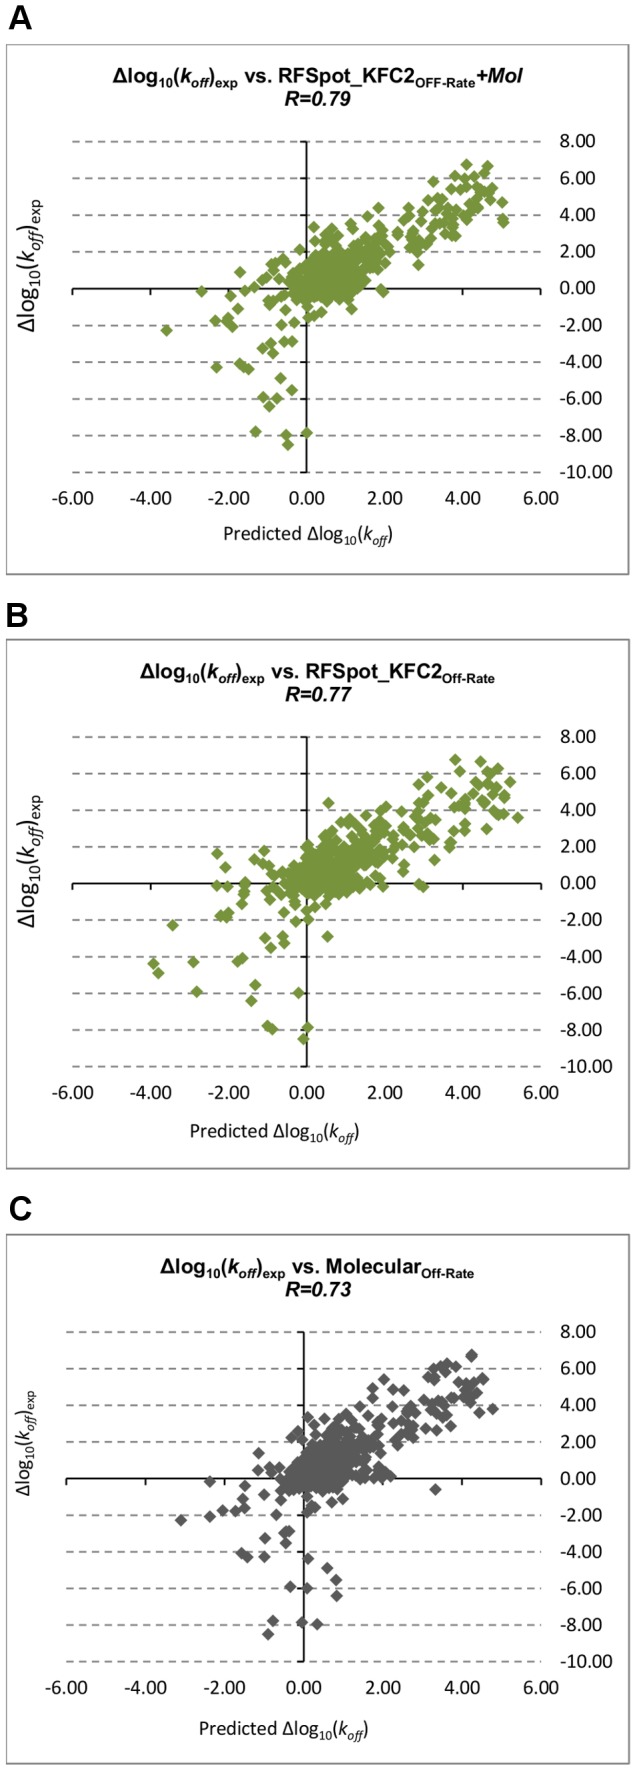
Figure 6. Off-rate prediction model scatter plots.

The relationship between experimental values for Δlog10(koff) and predicted values for Δlog10(koff) with (A) RFSpot_KFC2Off-Rate+MOL, best performing off-rate prediction model combining hotspot and molecular descriptors. Hotspot descriptors for this model are generated using the RFSpot_KFC2 hotspot prediction algorithm. (B) RFSpot_KFC2Off-Rate+MOL, best performing off-rate prediction model using only hotspot descriptors. Hotspot descriptors for this model are again generated using the RFSpot_KFC2 hotspot prediction algorithm. (C) MolecularOff-Rate, off-rate prediction model using molecular descriptors. The addition of hotspot descriptors as observed in (A) to molecular descriptor model as shown in (B) notably improves the prediction of stabilizing mutants, which are all found in the lower left quadrant for RFSpotKFC2Off-Rate+MOL.
