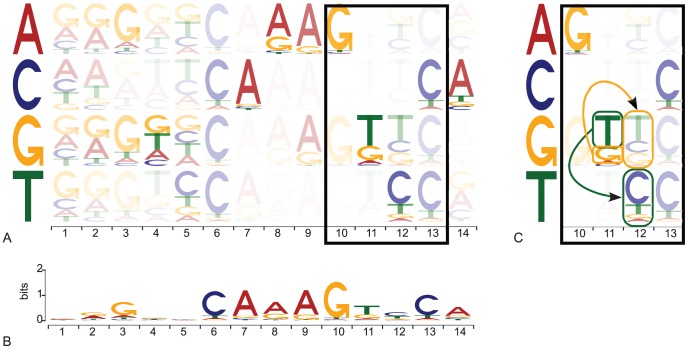
Figure 2. Sequence logo representing a TFFM.
(A) Graphical representation of a TFFM constructed for the Hnf4A TF. Each column corresponds to a position within a TFBS. Each row captures the probabilities of each nucleotide to appear depending on the nucleotide found at the previous position. The opacity of a case represents the probability of hitting this case depending on the probability of appearance of the corresponding nucleotide at the previous position (the higher the opacity, the higher the probability). (B) The summary logo compacts all the information to summarize the dense logo in (A). (C) Zooming in on the dense TFFM logo for positions 10 to 13 (corresponding to the box in (A)). We observe that a “C” is more likely to appear at position 12 if nucleotide “T” was found at position 11 whereas a “T” is more likely to appear at position 12 if nucleotide “G” was found at position 11.

