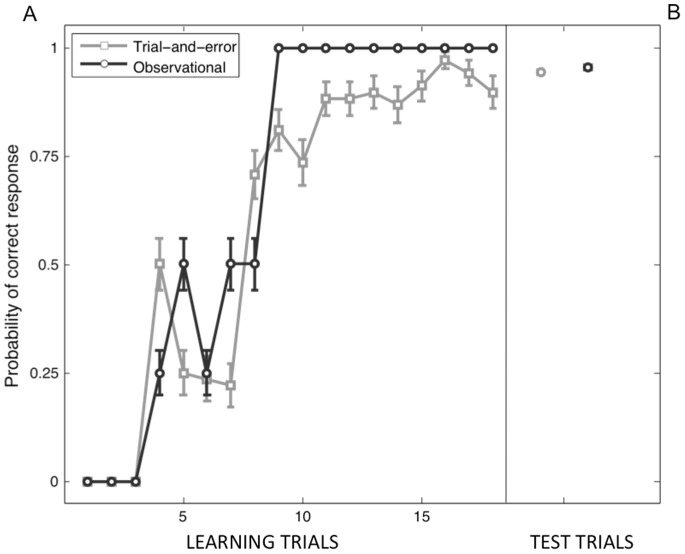
Figure 2. Behavioural performances of subjects in the fMRI learning sessions.
(A) Mean learning curve averaged across runs and subjects for the TE condition (gray curve) and the LeO condition (black curve). Note that the LeO curve represents the progression of the actor performance in the videos shown to the participant. Error bars indicate the standard error of the mean (SEM). (B) Mean percentage of correct responses in the TE-test and LeO-test sessions following learning. Error bars indicate the standard error of the mean (SEM).

