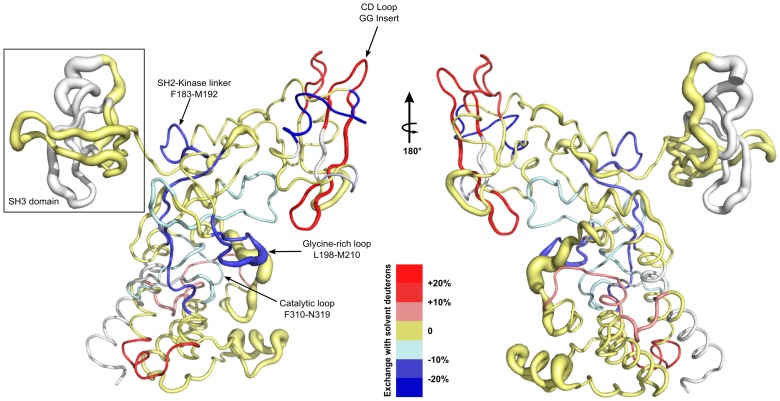
Figure 5. A combined representation of Molecular Dynamics simulations (MD) and Deuterium Exchange-Mass Spectrometry (DXMS) data showing the effects of SH2 domain's CD loop elongation mapped on a worm representation of the crystal structure of full length Csk.
DXMS data are shown according to the key at the bottom. Protected regions are represented by the blue gradient for the variant with respect to wild type while deprotected regions are represented by the red gradient. Regions in gold represent probes that show no significant difference in protection between the wild type and variant and gray represents absence of reliable DXMS probes. Protection criteria and classification are determined as described in figures 3 and 4 and the methods section. MD data are represented by the most statistically relevant divergence in root mean square fluctuation (RMSF) for the backbone heavy atoms represented by the thickness of the worm at any given position. Important motifs and domains are annotated based on the crystal structure of Csk.

