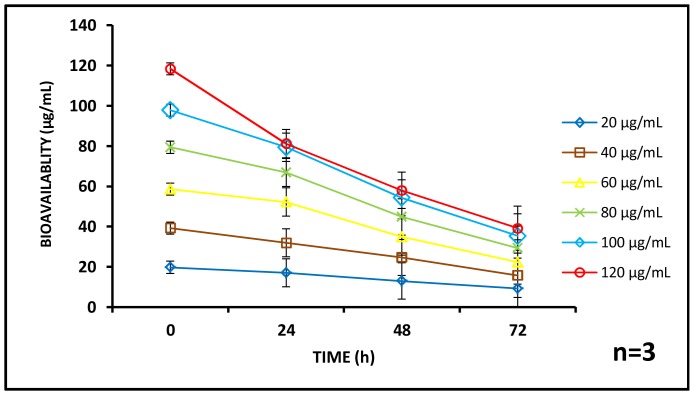
Figure 4. Bioavailability profile of aluminium oxide nanoparticles.
The available concentration of aluminium oxide nanoparticles in the test matrix is seen to decrease with respect to time. The rate of reduction of bioavailability is faster as the concentration of the nanoparticle increases. (n = 3).

