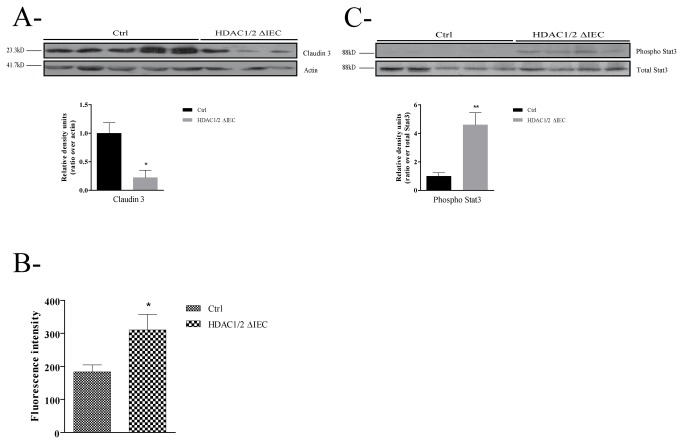
Figure 8. Conditional intestinal epithelial HDAC1/2 loss disrupts epithelial barrier function.
A. Total protein extracts from three to five control (Ctrl) or conditional intestinal epithelial HDAC1/2 (HDAC1/2ΔIEC) colons were separated on a 10% SDS-PAGE gel, transferred to a PVDF membrane and analysed by Western blot for expression of Claudin 3 (MW: 23.3 kD) and actin as a loading control. The histograms indicate the ratio of band intensities normalized to actin. Quantification of band intensity was performed with the Quantity One software. Results represent the mean ± SEM (*p≤0.05). B. To measure intestinal permeability, blood was recovered 3 h after gavage of 4-kDa FITC-labeled dextran (n=6). FITC serum concentrations were determined with a RF-5301PC spectrofluorometer (Shimadzu Scientific Instruments, Columbia, MD, USA). Results represent the mean ± SEM (*p≤0.05). C. Total protein extracts from four to five control (Ctrl) or conditional intestinal epithelial HDAC1/2 (HDAC1/2ΔIEC) colons were separated on a 10% SDS-PAGE gel, transferred to a PVDF membrane and analysed by Western blot for expression of Phospho-Stat3 and total Stat3 (MW: 88 kD). The histogram indicates the ratio of Phospho-Stat3 band intensities normalized to Stat3. Quantification of band intensity was performed with the Quantity One software. Results represent the mean ± SEM (*p≤0.05).

