
Figure 1. Venn diagrams constructed based on significantly different transcript abundance in gravistimulated rice shoot base.
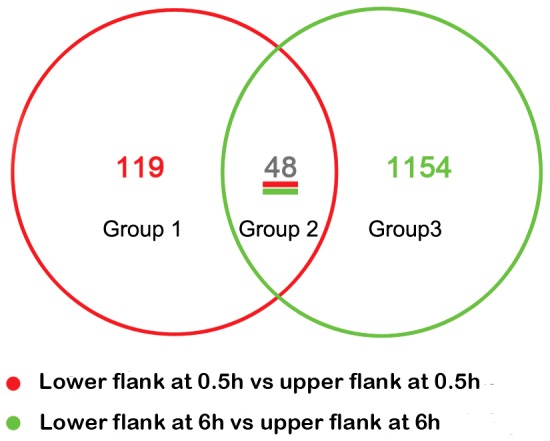
Venn diagrams show the distribution of transcripts that were significantly changed in abundance by at least 2-fold (P value <0.05) between the lower flank and upper flank of the rice shoot base at 0.5 h and 6 h after gravitropic stimulation.