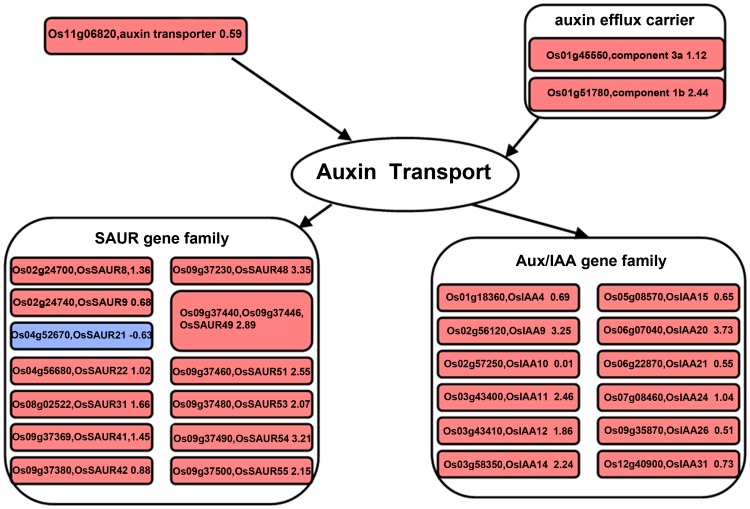
Figure 2. Changes of transcripts in the auxin related pathway at 6 h after gravistimulation.
Visualization of modulated gene expression in the auxin pathway: lower flank at 6 h vs. upper flank at 6 h. Significant fold changes in transcript abundance were log transformed and represented as up-regulated (red square) or down-regulated (blue square).

