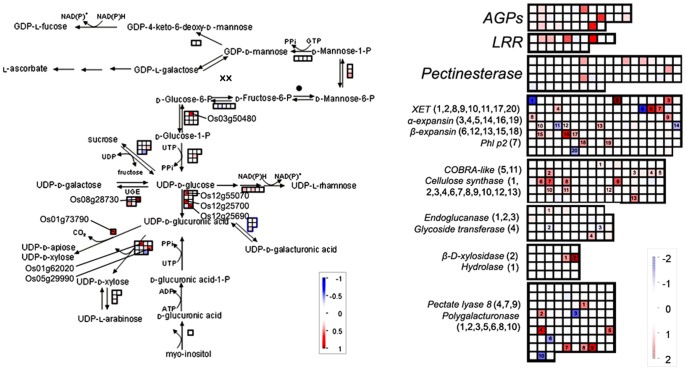
Figure 5. Changes of transcripts for cell wall precursors and cell wall protein related pathways between lower and upper half flanks at 6 h after gravistimulation.
MapMan output was used to illustrate the significant transcriptional changes across the tissue of cell wall precursors and cell wall proteins at 6 h after reorientation. The reported values are log transformed ratios of transcripts in the lower flank to the upper flank. Each transcript is indicated as being up-regulated (red square; increase in the ratio of the lower to upper transcript values) or down-regulated (blue square; decrease in ratio of the lower to upper transcript values). Squares arranged in rows and columns represent individual transcripts at a single time point in the process. The individual square in a given area has the same color as the guide bar in the same column. A filled circle indicates that no transcript was detected in the process. Significantly changed transcripts in each process were marked with a series of numbers.

