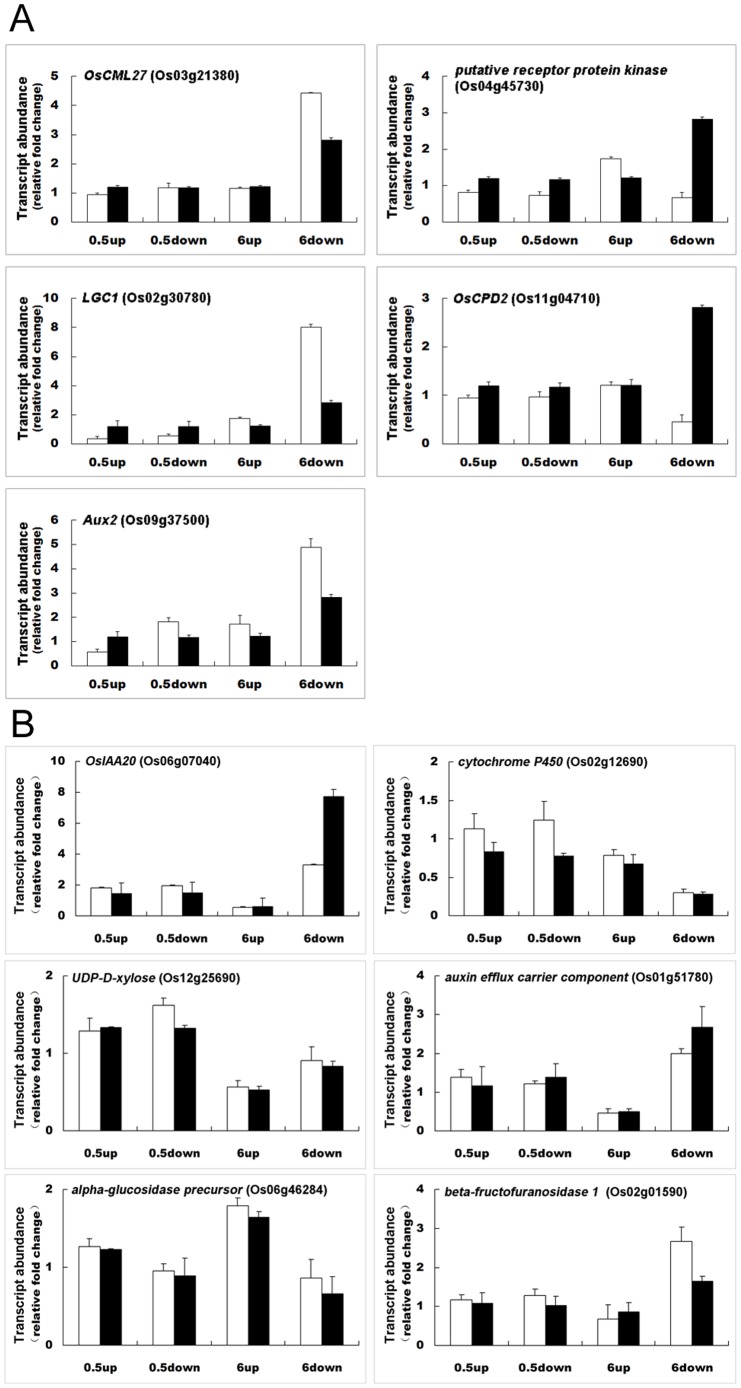
Figure 8. qRT-PCR validation of microarray analysis results.
Relative changes in transcript abundance after gravity stimulation compared to the vertical control were analyzed by the microarray assay, and relative changes in transcript abundance observed by qRT-PCR all utilized the non-reoriented control at the relevant time point as a reference. A. qRT-PCR analysis of OsCML27 (Os03g21380), OsCPD2 (Os11g04710), a transcript encoding a putative receptor protein kinase (Os04g45730), Aux2 (Os09g37500) and LGC1 (Os02g30780) expression. B. qRT-PCR analysis of OsIAA20 (Os06g07040), and coding genes for cytochrome P450 (Os02g12690), UDP-D-xylose (Os12g25690), auxin efflux carrier component (Os01g51780), α-glucosidase precursor (Os06g46284), β-fructofuranosidase 1 (Os02g01590). 0.5 h down, 0.5 h up, 6 h down and 6 h up represent for lower flank at 0.5 h, upper flank at 0.5 h, lower flank at 6 h and upper flank at 6 h, respectively. The relative mRNA abundance was calculated as the ratio between the control sample and gravistimulated sample at each time point. Values are means ± SD; n = 3; □ real-time PCR results; ▪ microarray data.

