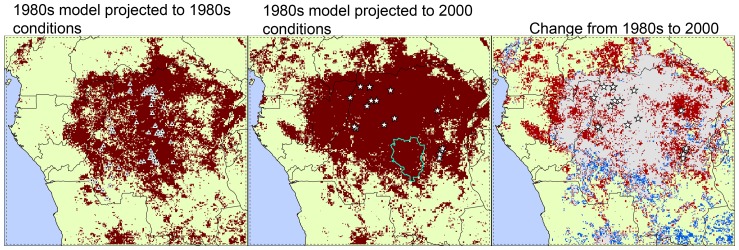
Figure 3. Environmentally suitable areas for MPX transmission in 1982–1986 and 2002–2006 identified by Maxent.
Ecological niche model projections using human MPX case reports and environmental conditions during 1982–1986 (left) and projections onto conditions in 2002–2006 (middle; white stars = recent human cases); dark red represents areas with suitable environmental conditions identified by Maxent. The blue polygon in the middle map represents Sankuru District, where monkeypox surveillance was performed betweeen 2006–2007 [5]. Change in suitability for MPX transmission (i.e., difference in model-based suitability) between the 1980s and 2000s is shown in the third map (right): red = expansion, blue = reduction, and gray = suitable areas in both periods. Statistics associated with these tests are in Table 1.

