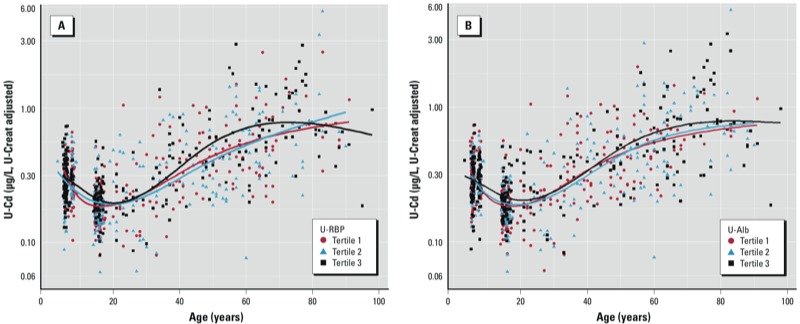
Figure 3.

Association between U-Cd and age by tertiles of U-RBP (A) and of U‑Alb (B) in the nonsmoking population (n = 840). Data were fitted using natural cubic splines with three knots placed at 25th, 50th and 75th percentiles. U-Cd values were significantly different between tertiles for U-RBP and U‑Alb from adolescence.
