
Figure 4. DArT PCA R2 and 95% confidence interval from the GBS bootstrap.
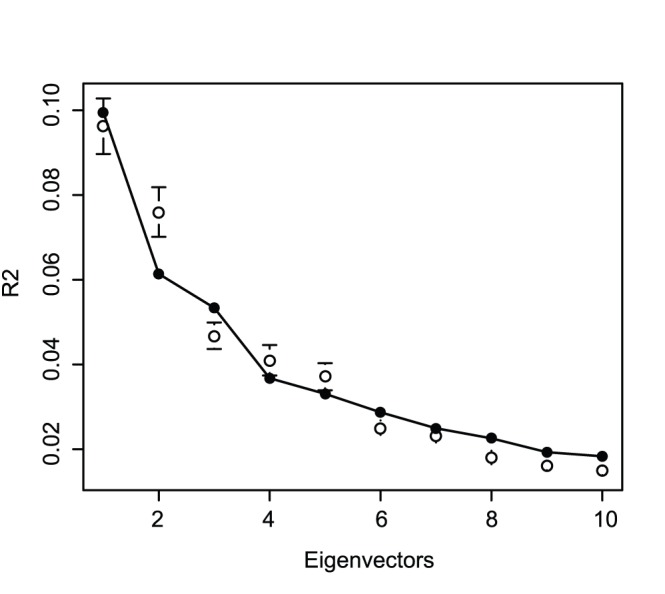
The filled circle corresponds to the DArT and the empty circle corresponds to the mean of the 1000 GBS bootstrap samples.
Official websites use .gov
A
.gov website belongs to an official
government organization in the United States.
Secure .gov websites use HTTPS
A lock (
) or https:// means you've safely
connected to the .gov website. Share sensitive
information only on official, secure websites.
The filled circle corresponds to the DArT and the empty circle corresponds to the mean of the 1000 GBS bootstrap samples.