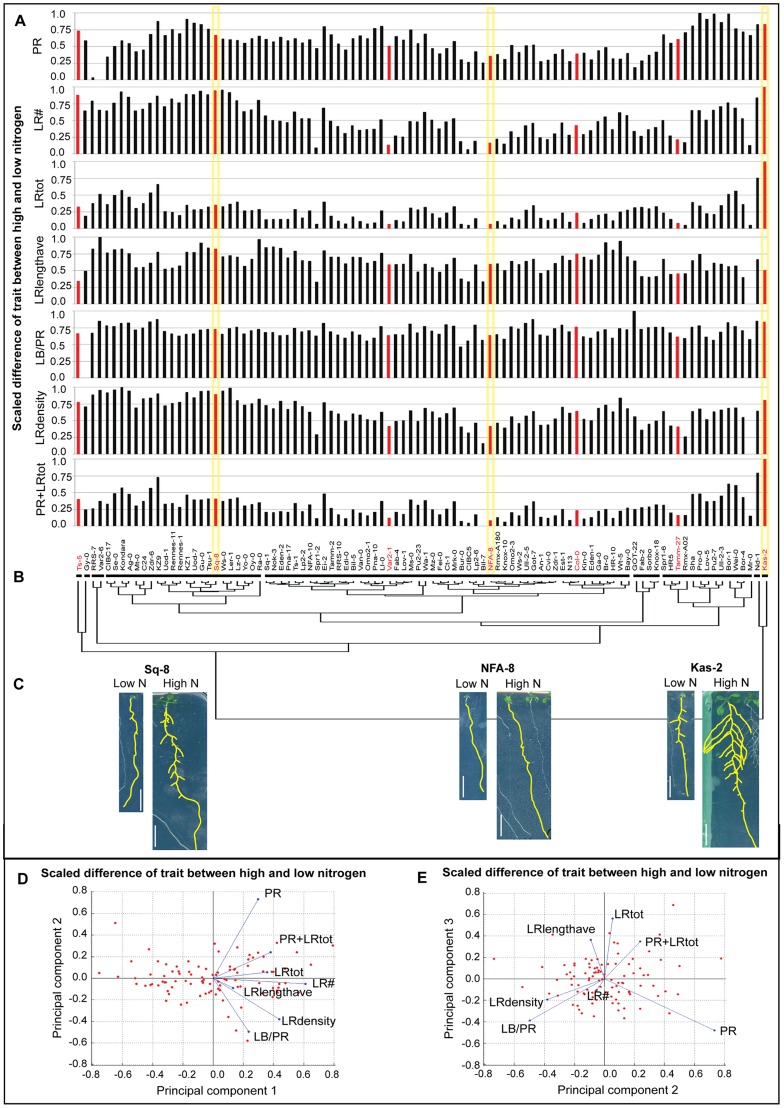
Figure 2. Changes in root traits among natural variants in two different nitrogen environments.
The difference between root trait values on low and high nitrogen (δ highN-lowN) is represented in the form of individual bar charts (A) and trait differences were used to form a dendrogram of accessions resulting in nine clusters as indicated by horizontal lines (B); the seven accessions chosen for expression analysis are highlighted in red. (C) Images of low N and high N grown seedlings from representative accessions of a ‘strong N-responder’ Sq-8, a ‘weak N-responder’ NFA-8, and the ‘super N-responder’ Kas-2 with yellow highlighting on their trait difference values on (A); scale bars = 1 cm. (D–E) PCA analysis of the δ highN-lowN for the seven accessions. Red markers indicate position of 96 accessions as determined by their trait values in the given principal components. Blue lines represent vectors that quantify the magnitude and direction of a trait's contribution to that axis. For example, in (E), an accession with a high score in PC3 will have a high LRtot value. PC2 is not informative for LRtot but accessions with a long primary root (PR) will score highly on this axis. The percent variability explained by PCs 1, 2 and 3 are 64%, 17%, and 10%, respectively.

