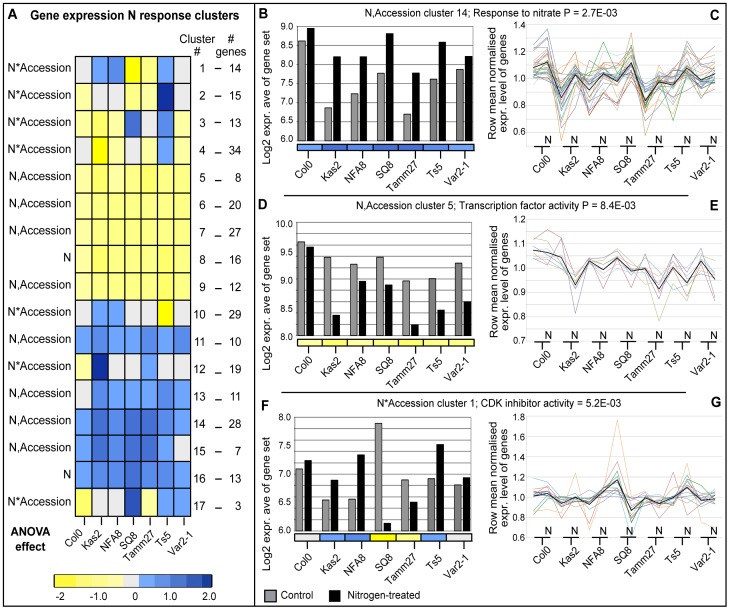
Figure 3. Global expression analysis of genes differentially regulated by nitrogen across representative accessions.
(A) A heatmap showing cluster patterns of N responses across accessions ordered by clustering on Euclidean distance; see color scale bar for log2 fold change magnitude and direction. Among N*Accession genes, the GO terms ‘response to stimulus’ (30 genes, P = 8.5E-03), and ‘RNA binding’ (9 genes, P = 8.1E-03) were both overrepresentated; BioMaps GO term overrepresentation analysis. (B,D,F) Average log2 microarray expression values for three representative gene response clusters in control and N-treated experiments. (C,E,G) Row mean (per gene)-normalized expression levels of individual genes are plotted for all genes within the three clusters shown in B,D,F (colored lines), together with the centroid for each cluster (black line); lines are used to connect expression levels between accession control and N-treated experiments for visualization purposes. (B,C) A N-induced cluster in all accessions (N,Accession cluster 14, n = 28) in which ‘response to nitrate’ is overrepresented (2 genes, P = 2.7E-03). (D,E) A N-repressed cluster in all accessions (N,Accession cluster 5, n = 8), in which ‘nucleic acid binding transcription factor activity’ is overrepresented (3 genes, P = 8.4E-03). (F,G) A N-regulated cluster with differential induction in accessions (N*Accession cluster 1, n = 14), in which ‘cyclin-dependent protein kinase (CDK) inhibitor activity’ is overrepresented (1 gene, P = 5.2E-03).

