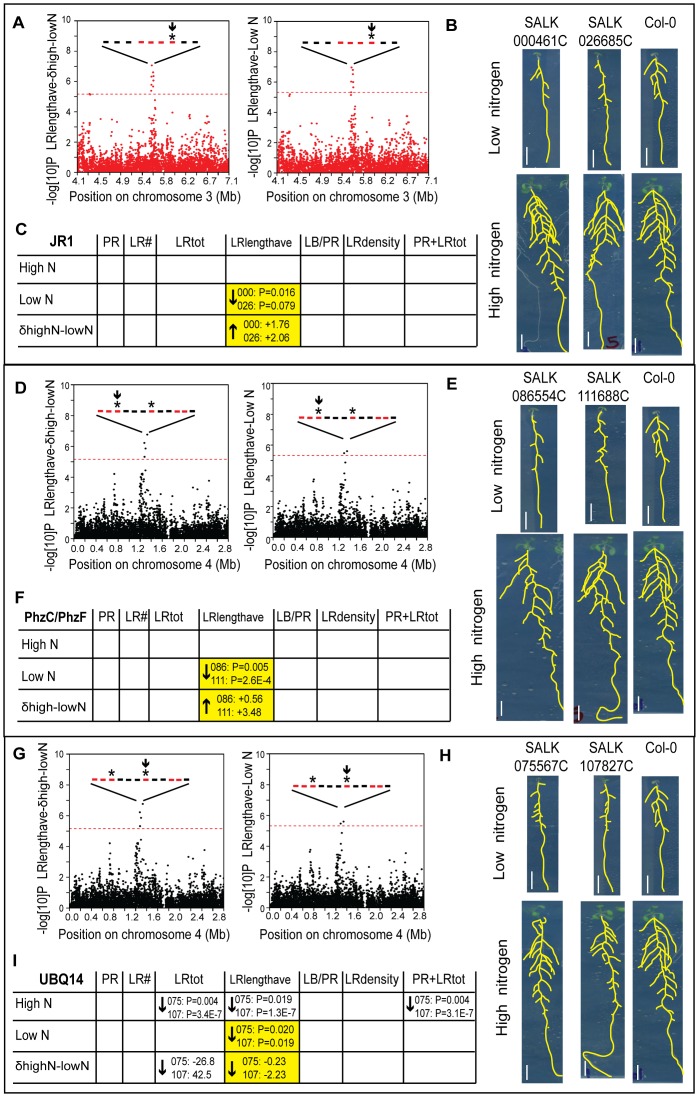
Figure 4. Functional validation of root architecture regulators JR1 (A–C), PhzC/PhF (D–F), and UBQ14 (G–I).
(A,D,G) Genome-wide P values from the GWAS magnified around SNP hits; horizontal dashed line corresponds to the 5% FDR threshold that corrects for multiple simultaneous tests. Genes within the 20 Kb boundary around the SNP hits are represented with bars; red color denotes genes whose expression changes in response to nitrogen or among accessions (Table S11), asterisks denote mutants with phenotypes, arrow denotes the gene described in each panel. (B,E,H) Images of four 12 day old seedlings grown on low or high N for two T-DNA alleles in each gene and Col-0; scale bars = 1 cm. (C,F,I) GWAS prediction on trait phenotypes (yellow) and observed phenotypes from confirmed T-DNA alleles indicated with arrows with P value, where arrow denotes direction of change in mutant vs. wild type and t-test P value shows significance of the trait difference in mutant vs. wild type (denoted with first three SALK digits); see Table S12.

