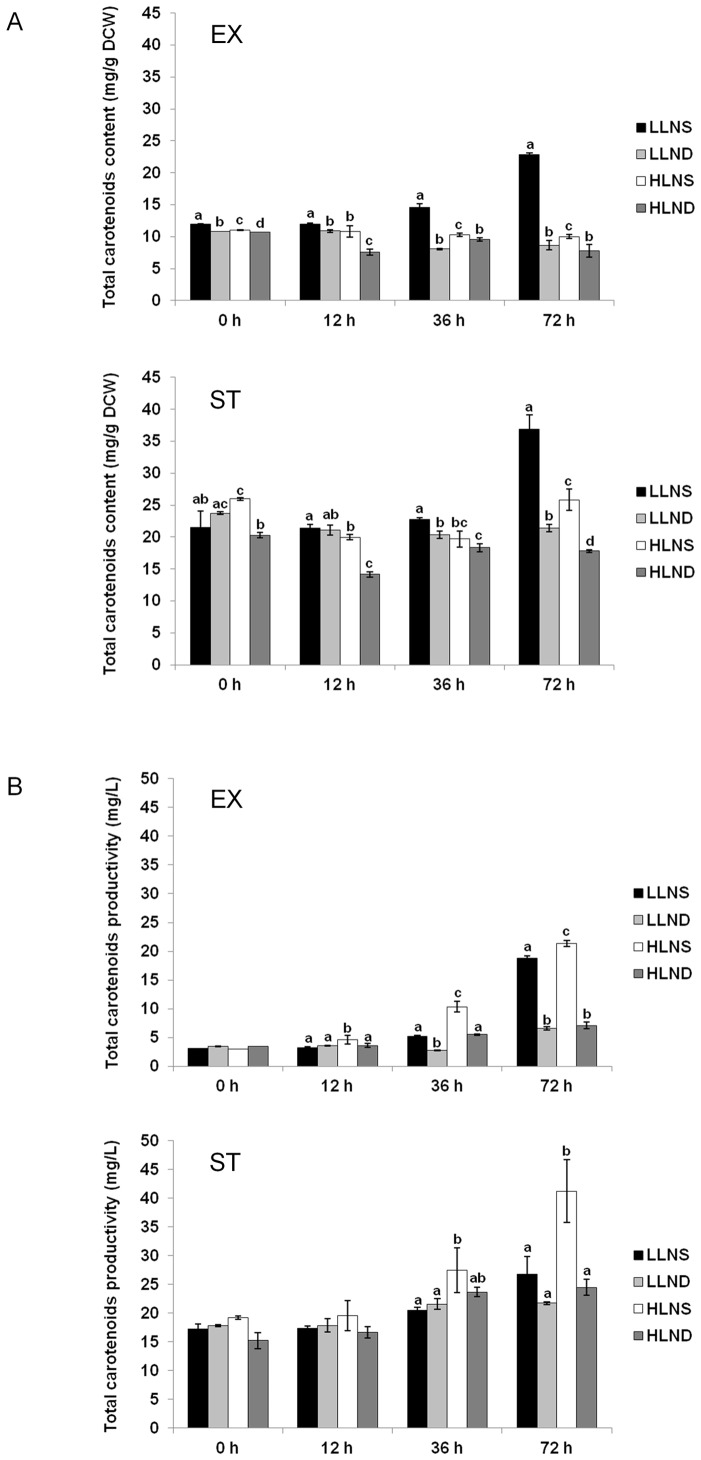
Figure 3. Effect of high light intensity and nitrate deficiency on the (A) total carotenoid content (mg/g dry cell weight) and (B) productivity (mg/L) of D. tertiolecta under shifted cultivation conditions at the exponential (EX) and stationary (ST) phases.
Vertical bars represent the standard deviations (n = 4). Different alphabet in the same time point represent significant differences (p<0.05) within samples under various culture conditions. Sharing the same alphabet indicates no significant differences among levels in carotenoid content or productivity. LLNS, low light intensity and nitrate sufficiency; LLND, low light intensity and nitrate deficiency; HLNS, high light intensity and nitrate sufficiency; HLND, high light intensity and nitrate deficiency.

