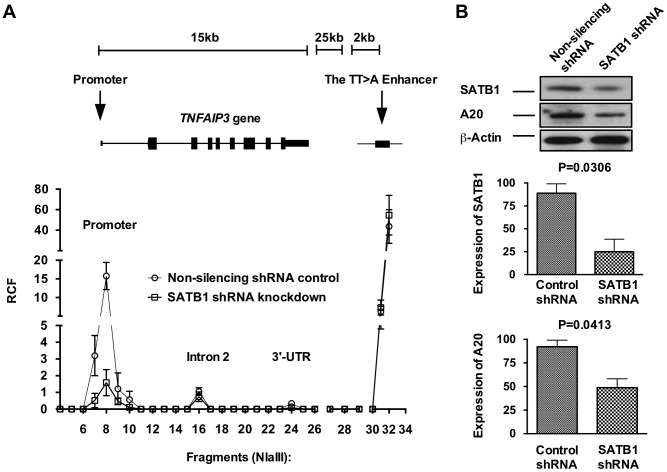
Figure 4. SATB1 is required for the TT>A enhancer-promoter interaction and TNFAIP3 transcription.
a. Shown is a representative 3C assay from 3 independent experiments in HEK293T cells. Relative crosslinking frequencies (RCF) were normalized to both GAPDH loading control and a TNFAIP3 BAC clone and plotted according to its location to TNFAIP3 gene and the TT>A enhancer. High local interaction frequencies near the TT>A enhancer serve as a positive control (fragments 30–34). b. The top panel shows the protein expression levels of SATB1 and A20 were detected using Western blots with antibodies against SATB1 and A20, respectively. β-actin was used as loading control. The bottom two panels show densitometer quantification of the relative expression of SATB1 (middle panel) and A20 (lower panel) normalized to β-actin. Error bars represent standard error of the mean from 3 independent experiments. Differential protein levels between SATB1 knockdown and non-silencing shRNA control were calculated using Student's t-test.

