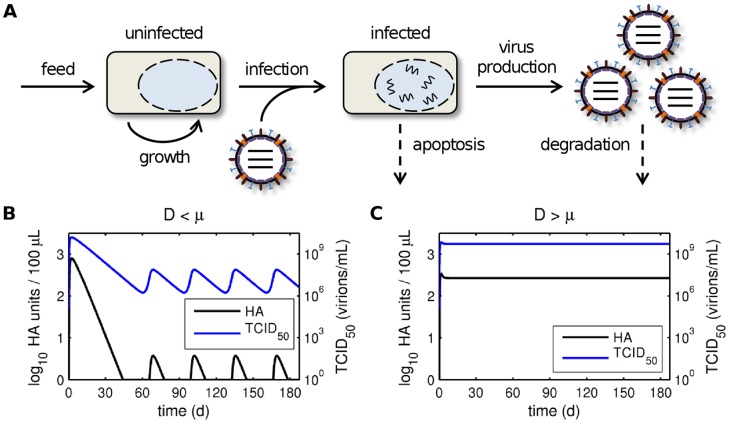
Figure 4. Model of continuous infection in the absence of DIPs.
(A) Schematic representation of the model for continuous influenza A virus infection in the absence of DIPs (see Eq. (2)). The continuous harvest of cells and viruses was omitted for illustrative reasons. (B, C) Simulated virus titers for a dilution rate of the virus reactor D which is (B) lower than the specific growth rate µ and (C) higher than the specific growth rate µ. Parameters were chosen according to Table S1 except that the dilution rate in (B) was reduced to D = 10−8 1/h.

