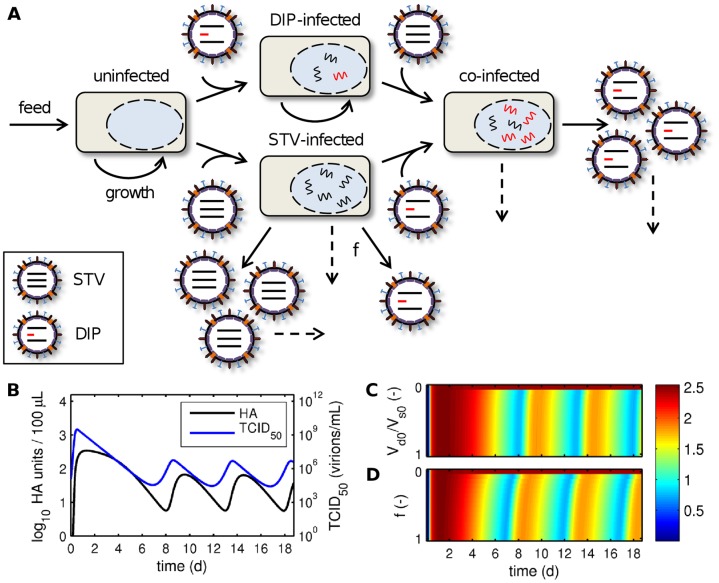
Figure 5. Model of continuous infection in the presence of DIPs.
(A) Schematic representation of the model for continuous influenza A virus infection in the presence of DIPs (see Eq. (1)). Dashed arrows indicate apoptosis or virus degradation. The continuous harvest of cells and viruses was omitted for illustrative reasons. (B) Simulated virus titers for the parameters used in Table S1. (C, D) Log10 HA units/100 µL over process time for (C) various ratios of initial DIPs (Vd0) to STVs (Vs0) neglecting de novo DIP generation (f = 0) and (D) different rates of de novo DIP generation by STV-infected cells (f denoting the fraction of DIP to STV production) without DIPs being initially present (Vd0 = 0).

