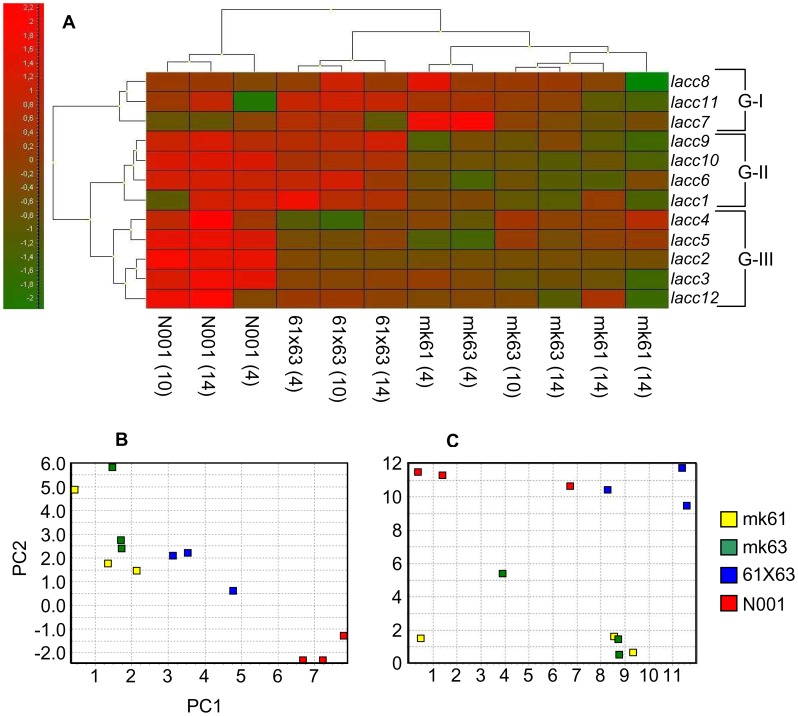
Figure 6. Multivariate analysis of expression profiles.
Cluster analysis of genes and samples using a heat map (A), principal component analysis (B) and Kohonen self-organising map (C). Sample loadings of the two principal components are shown in Table S10 in File S1.

