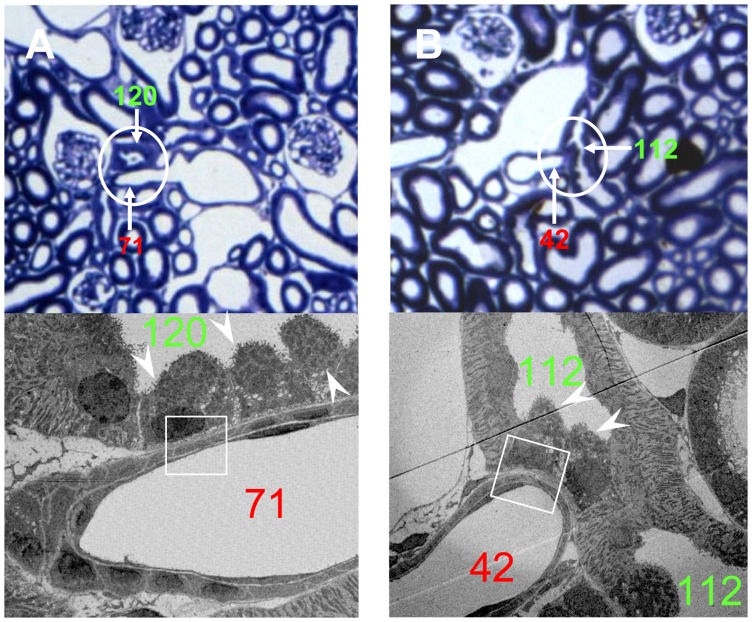
Figure 2. Corresponding LM and EM micrographs of the single contact A and B in Figure 1.
(A) show Af-Art (Nr. 71) with tubule (Nr. 120); (B) show Af-Art (Nr. 42) and tubule (Nr. 112). The top images are LM from the corresponding plastic sections stained with toluidine blue. The bottom images are EM from the framed areas in the LM. Note the aggregation of intercalated cells in the DCT at the T-A contact sites (white arrowheads). LM ×400; EM ×5000.

