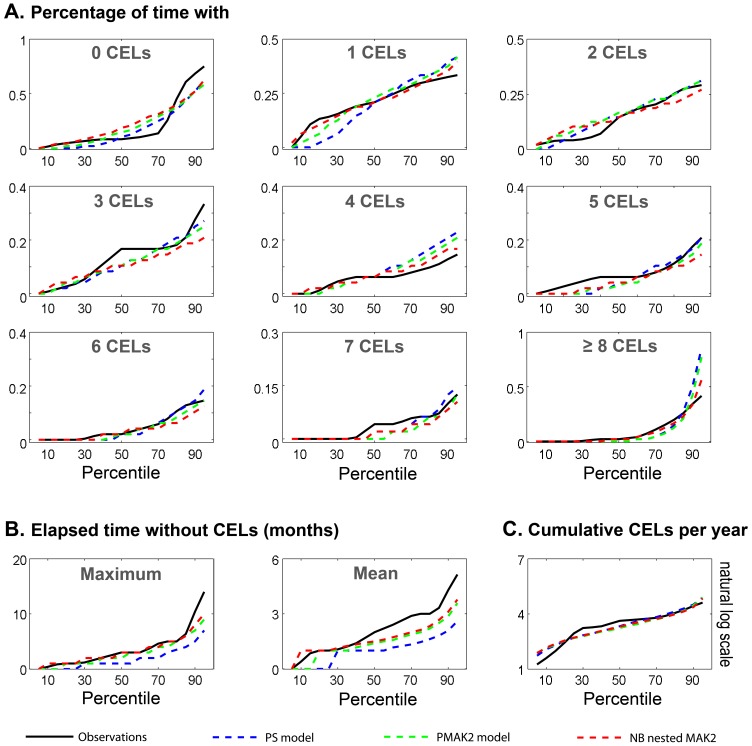
Figure 3. Visual Numerical Predictive Check (VNPC).
Different dynamic descriptors were calculated for the observed data (black solid line) and the simulated data from the different selected models (dashed lines). Those descriptors were evaluated at different percentiles from 5th to 95th with an increasing step of 5.

