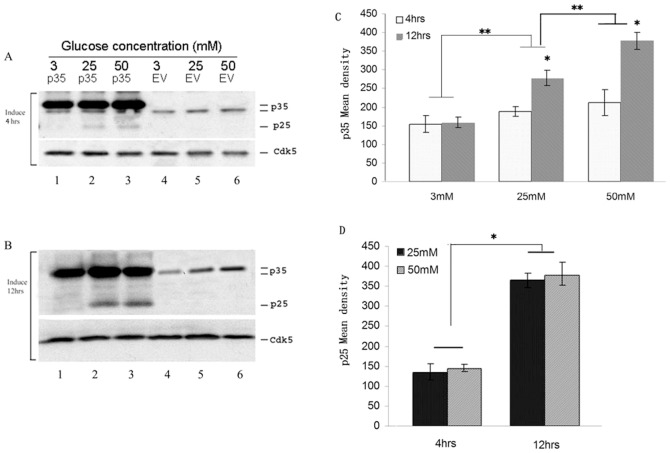
Figure 1. A time course and concentration course dependence of produced p25 expression in overexpression of p35 in HG stressed Min6 cells.
A &B Overexpression of p35 produced p25 expression in Min6 cells stressed with HG (25 mM or 50 mM glucose) for 4 hrs (A, panel 1,lanes 2 and 3) and 12 hrs (B, panel 1, lanes 2 and 3). It exhibited a time dependence (Comparing A&B, penal 1, lanes 2 and 3). Cdk5 expressions were not affected by about stimulations (A&B, panel 2, lanes 1–6). C Quantification of Overexpression of p35. D Quantification of p25 expression produced by overexpressing of p35 plus stressed with HG in Min6 cells. (*shows time course comparison; ** shows dosage course comparison). Data represent mean ± SE of three experiments.

