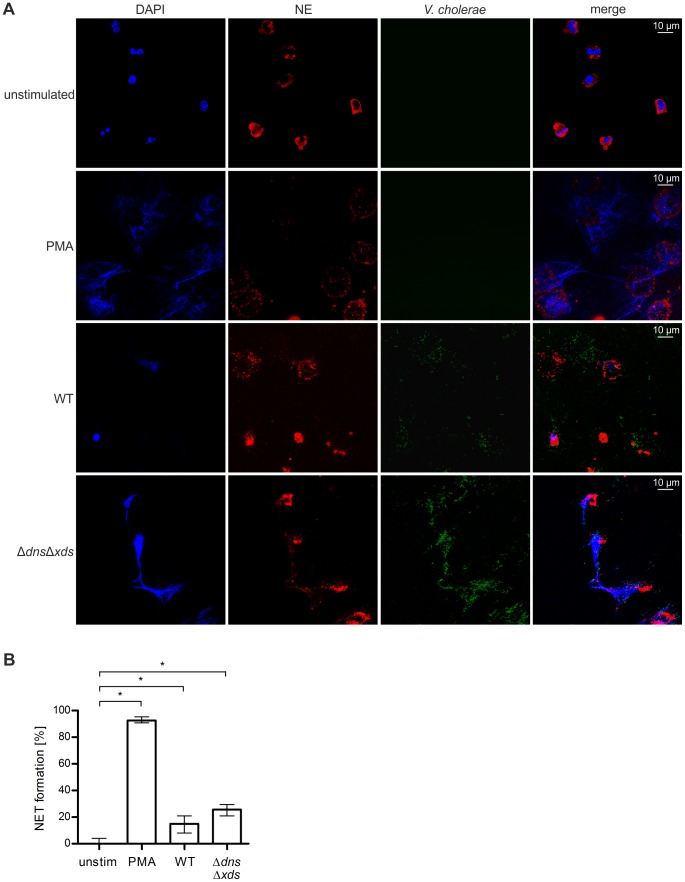
Figure 4. Visualization of NET formation by V. cholerae.
Human neutrophils were stimulated for 6 h either with PMA, V. cholerae WT or ΔdnsΔxds mutant (MOI 40) or left untreated (unstimulated). A. Shown are representative immunofluorescent micrographs of DNA (DAPI, blue) and neutrophil elastase (NE, Cy3 conjugated, red) stained samples as well as V. cholerae expressing GFP (green). B. Microscopic evaluation of NET formation by human neutrophils stimulated with PMA, V. cholerae WT or ΔdnsΔxds mutant or left untreated (unstim). The percentage of cells undergoing NET formation was determined using ImageJ as explained in the Materials and Methods section. Shown are medians with the interquartile range. At least nine images from two independent donors were analyzed for each data set. Significant differences between the data sets are marked by asterisks (P<0.05; Kruskal-Wallis test followed by post-hoc Dunn's multiple comparisons).

