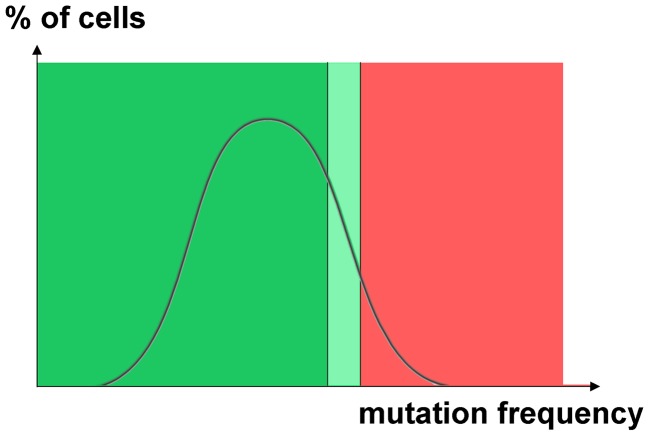
Figure 7. Hypothetical distribution of cells with different induced mutation rates.
In the cartoon we used normal distribution as an example. The right side of distribution (highlighted by light green and by red rectangles) contains cells with a very high induced mutation rate. The fraction of hypermutable cells explains the observed increase of mutation frequencies in diploids. The selection of CanR driver mutants in diploids results in the recovery of thousands of passenger mutations. These mutants originated from a transiently hypermutable fraction of cells that survive an extremely high frequency of mutations. Such cells die in haploids (red zone) but survive in diploids. Only the hypermutators from the light green zone survive in haploids. The size of this fraction can be substantial, because mutation avalanches evidence for transient hypermutagenesis was even observed in the genomes of unselected HAP-treated non-mutant clones.

