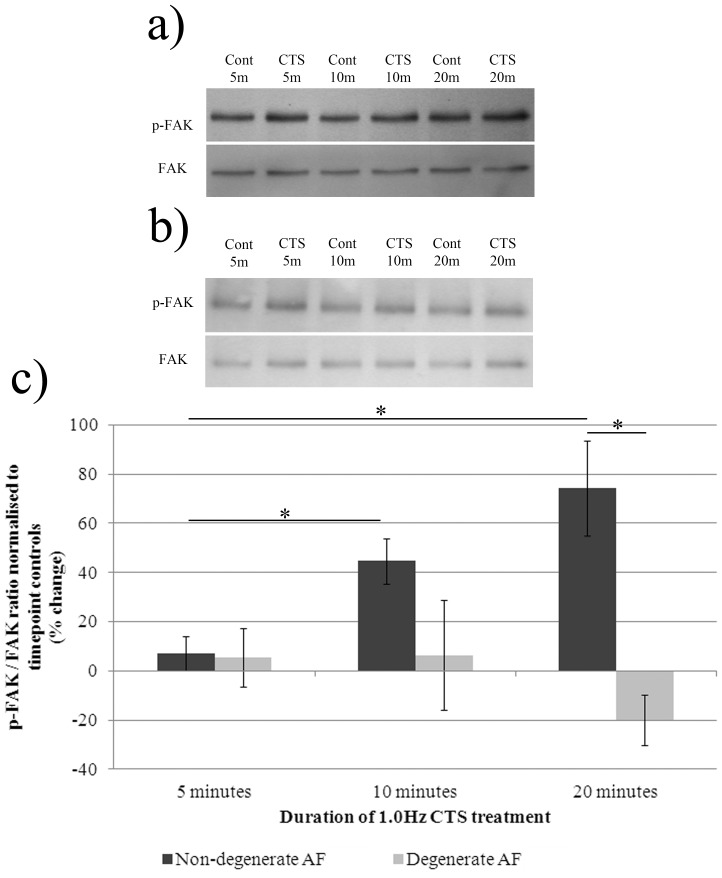
Figure 3. Phosphorylation of FAK following treatment of AF cells derived from non-degenerate and degenerate IVDs with 1.0 Hz CTS.
AF cells derived from non-degenerate (n = 4) and degenerate (n = 3) IVDs were treated+/−1.0 Hz CTS in serum-free media and total protein extracted at timepoints of up to 20 minutes. Mechanically stimulated and unstimulated A) non-degenerate and B) degenerate protein samples (5 µg/well) were separated using 10% SDS-PAGE and probed using primary antibodies against phosphorylated FAK. Blots were then stripped using a stripping buffer, re-blocked and probed using an antibody against total FAK protein. C) The density of bands was quantified using a Syngene imaging system and the ratio of phosphorylated: total FAK protein normalised to timepoint controls and plotted as % change. *denotes a significant change (p≤0.05) between treatment groups.

