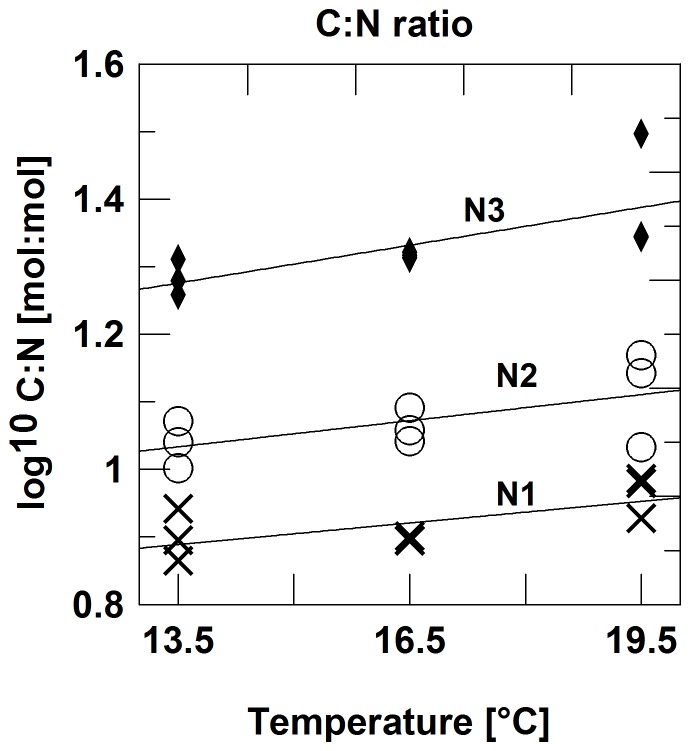
Figure 1. Particular matter C∶N ratios increase with tmeperature and decrease with dilution rate.
Molar C∶N ratios of particulate, organic matter in response (log10-scale) to temperature and nutrient regime; N1: 50% dilution three times per week; N2: 25% dilution three times per week; N3: no dilution.

