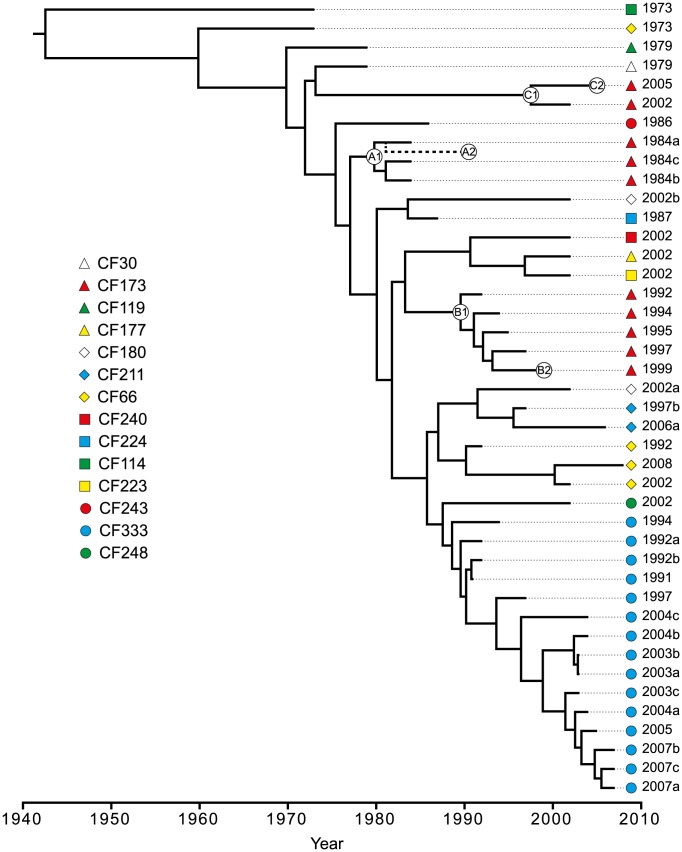
Figure 5. Bayesian phylogenetic reconstruction and divergence date estimates of the P. aeruginosa DK2 clones.
Bayesian statistics were used to estimate the divergence times of predicted ancestors. The tree was based on 736 unique SNPs identified from whole-genome sequencing. Circles labeled A1, A2, B1, B2, C1, and C2, respectively, denotes the position of the first and last genotype of each of the DK2 sub-lineages A, B, and C which were observed to have infected patient CF173. The position of CF173-1991 (A2) is approximated from an equivalent Bayesian phylogenetic analysis including the hypermutator isolates (Figure S3).

