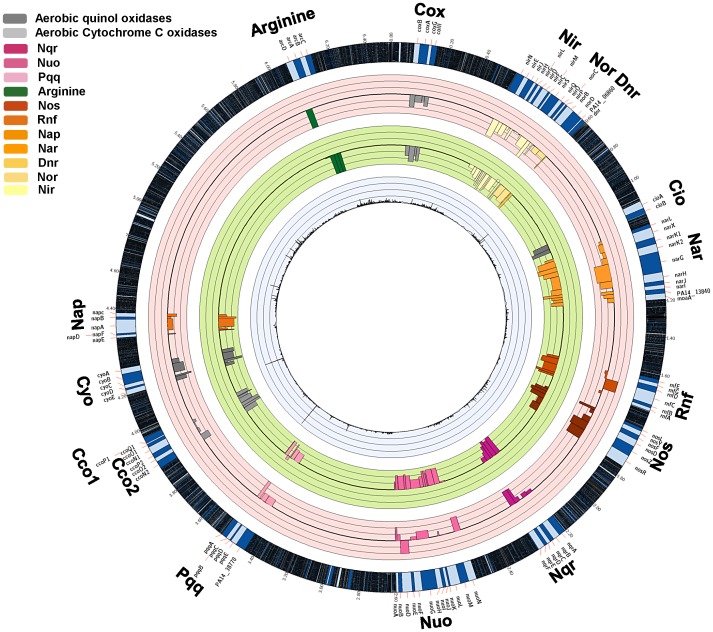
Figure 6. Representation of the changes in the occurrence of Tn interrupted genes encoding for proteins involved in energy production.
Tn insertions in the genes involved in the oxygen-dependent respiratory pathways (grey bars), in the denitrification (gradient of yellow/brown bars), in the utilization of energy arginine via the ADI pathway (green bar) and in several other oxygen independent energy generating pathways (gradient of purple bars) showed a decrease in vivo fitness. Each circle is as defined in the legend to Figure 3.

