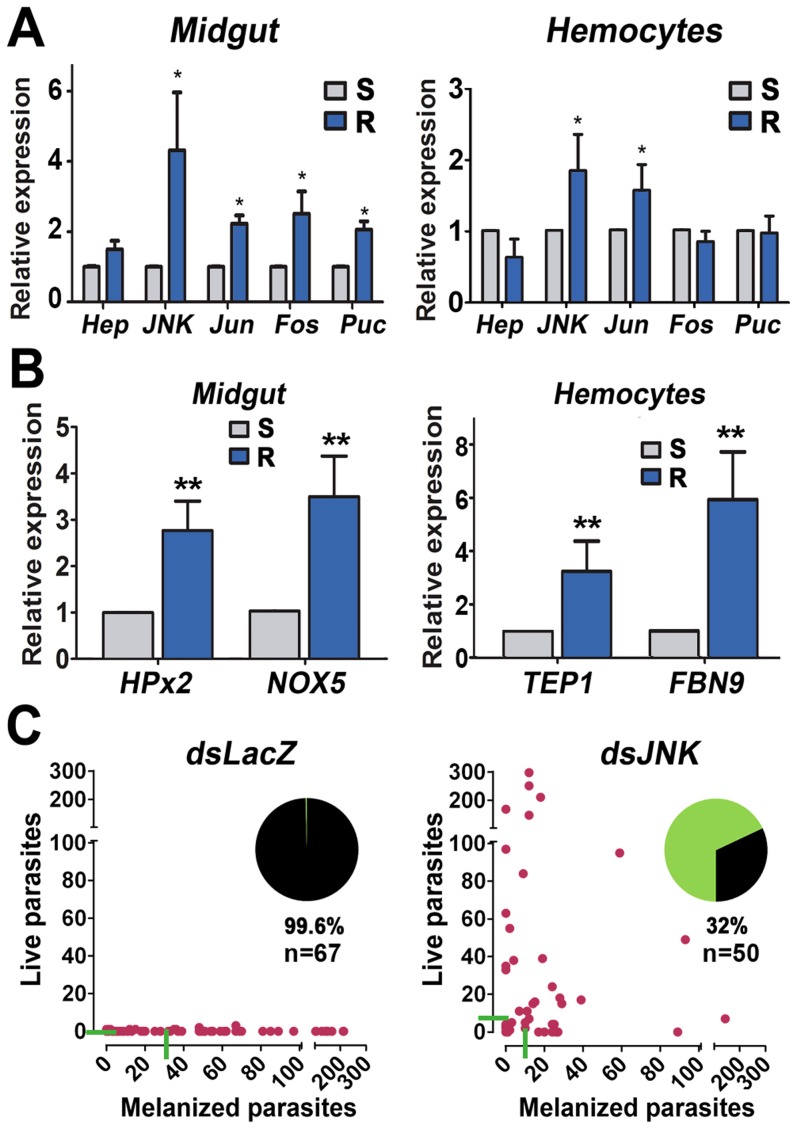
Figure 4. Participation of the JNK Pathway in L3–5 Mosquitoes Refractory (R) responses to Plasmodium berghei Infection.
(A) Basal mRNA expression of genes from the JNK pathway in the midgut and hemocytes of G3 susceptible (S) (gray) and R (blue) mosquitoes. (B) Expression of effector genes regulated by the JNK pathway in S (gray) and R (blue) mosquitoes. Basal mRNA levels of HPx2 and NOX5 in the midgut, and of TEP1 and FBN9 in hemocytes. Graphs represent the expression level in R females, relative to S females, that were adjusted to a value of “1”; for R females samples the bars represent the SEM of three biological replicates from independent experiments (see Table S4). P-values determined by paired Student's-T test after log2 transformation; *, p<0.05, **, p<0.01, ***, p<0.001. (C) Effect of silencing JNK (right panel) in the number of melanized and live parasites on individual midguts of R mosquitoes. Red dots indicate the number of parasites on an individual midgut, live (y-axis) and melanized (x-axis). Green horizontal bars indicate median infection intensities. Inset pie graphs represent the percentage of total parasites for each group displaying a live (green) or melanized (black) phenotype; percentage displayed refers to melanized parasites. Graphs represent data from three biological replicates (see Table S10). (n = number of midguts analyzed).

