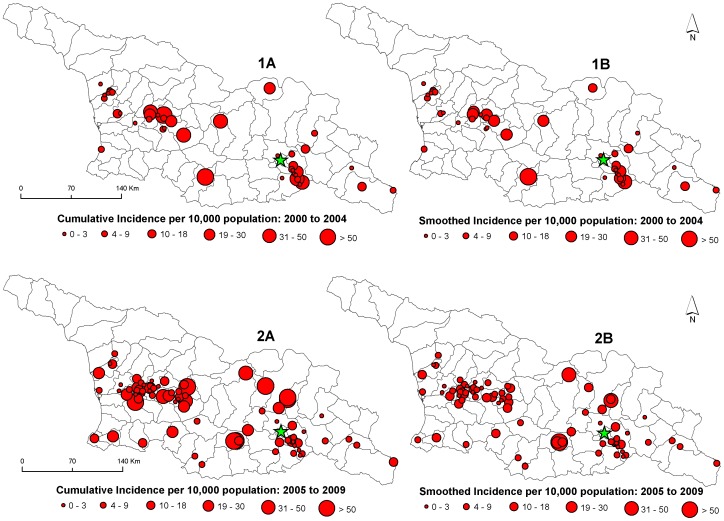
Figure 2. Maps showing the cumulative incidences of human cutaneous anthrax in Georgia at the community level.
Symbol sizes represent cumulative incidence risk per 10,000 population for period 1 (1A) and period 2 (2A). Empirical Bayes Smoothing estimates were calculated for both period 1 (1B) and period 2 (2B) to adjust for population heterogeneity.

