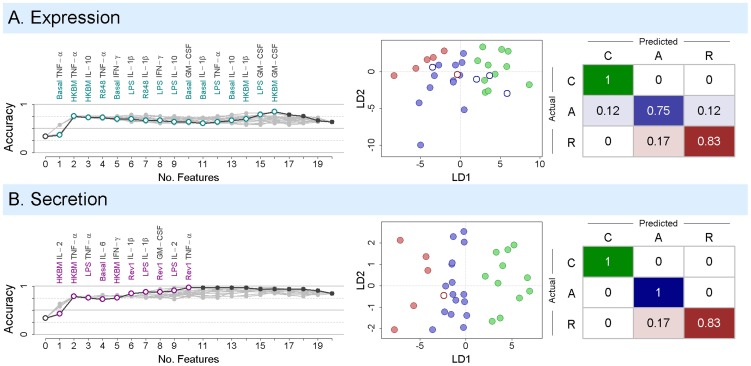
Figure 6. Model selection and classification results.
Response variables were selected and a linear discriminant classifier was trained using the transformed gene expression (A) or cytokine secretion data (B). The left panels show the results of 20 model selection runs, with the best-performing classifier highlighted in color. The variable included after each step in the forward selection is listed for the optimal model. Zero features is equivalent to random guessing. The center column shows all 33 patients after being mapped by the first (LD1) and second (LD2) linear discriminant functions used by the best-performing classifier. Classification performance is summarized by the confusion matrix on the right. This matrix gives the proportion of (C)ontrol, (A)cute, and (R)elapse patients that were correctly (on-diagonal) and incorrectly classified (off-diagonal).

