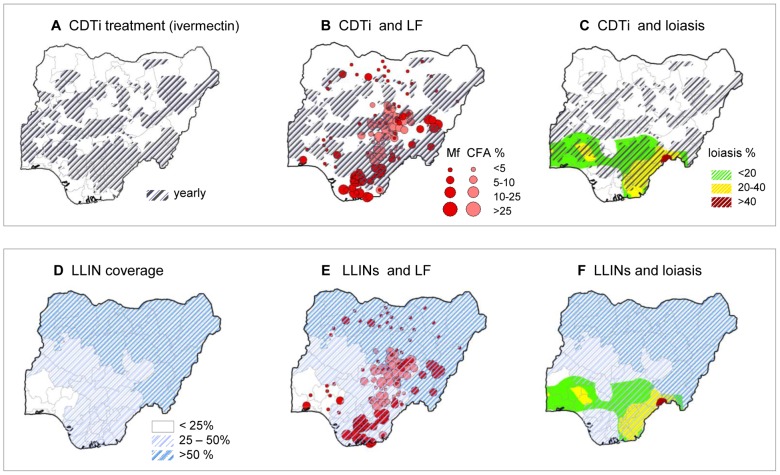
Figure 5. LF prevalence and intervention distribution overlap.
a. CDTi treatment (ivermectin). b. CDTi and LF. c. CDTI and loaisis. d. LLIN coverage. e. LLINs and LF. f. LLINs and loiasis. Note: Data source for CDTi (5a) based on WHO-APOC Country profile – Nigeria [31] (shaded grey) and for LLIN coverage (5d) based on Malaria Indicator Survey [40] (shaded blue) to highlight the geographical overlap with CFA and Mf data prevalence points from Table S1(5b and 5e) and loiasis map by Zouré et al. 2011 [7] (5c and 5f) respectively.

