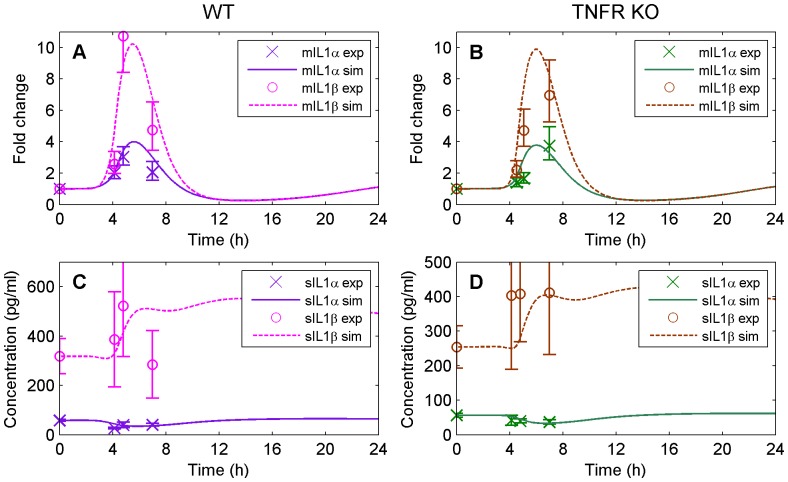
Figure 4. Model simulation (solid and dashed lines) versus experimental data (markers) for the IL-1 family.
(A) represents the mRNA accumulation of IL-1 and IL-1
 for WT, (B) the mRNA accumulation of IL-1
 and IL-1
 for TNFR KO (data used for validation only), (C) the plasma concentration of IL-1
 and IL-1
 for WT, and, (D) the plasma concentration of IL-1
 and IL-1
 for TNFR KO (data used for validation only).

