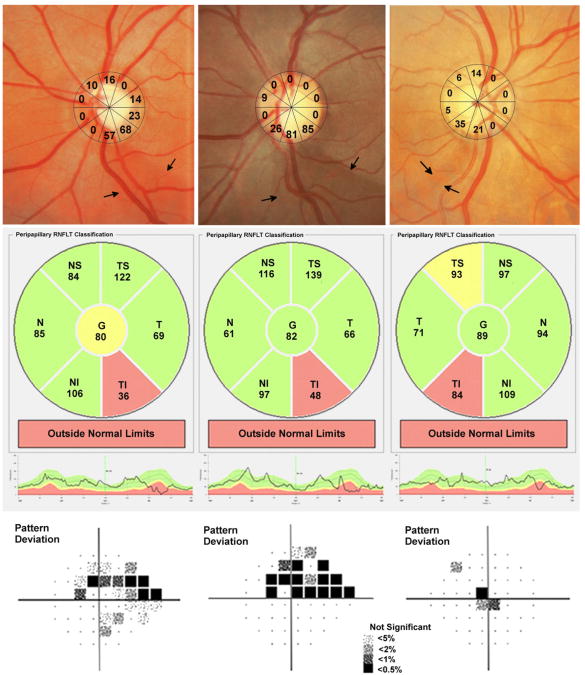
Figure 5.
Examples of 3 glaucomatous eyes with visible localized retinal nerve fiber layer (RNFL) defects. The optic disc photographs show the estimated retinal ganglion cell loss (estimated using the combined structure function index) in each of ten sectors of the structure function map.(Top row) The first example shows a visible RNFL defect inferior-temporal to the optic disc.(Top left) The estimated retinal ganglion cell loss in the two sectors corresponding to the defect is 57 to 68%. There is good agreement with the spectral domain optical coherence tomography RNFL thickness map, which shows RNFL loss in the inferior-temporal region (Center left) and with standard automated perimetry showing a superior arcuate defect.(Bottom left). The second example shows a RNFL defect associated with an estimated retinal ganglion cell loss of 81 to 85% (Top center) and the third example a RNFL defect associated with an estimated retinal ganglion cell loss of 21 to 35%.(Top right) The corresponding spectral domain optical coherence tomography (Center row) and standard automated perimetry (Bottom row) results for these eyes are also shown.

