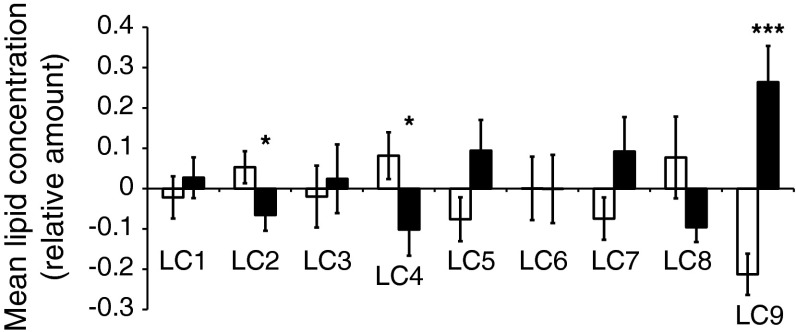
Fig. 1.
Mean lipid levels within each cluster, shown separately for patients with NAFLD (NAFLD+, black bars) and without NAFLD (NAFLD−, white bars) in the biomarker-discovery cohort. The data for each lipid are scaled to zero mean and unit variance. Statistical comparison was performed using the two-sided t test. The cluster summaries are shown in Table 2. Error marks show standard error of the mean. *p < 0.05 vs NAFLD−; ***p < 0.001 vs NAFLD−. For LC7 the two groups are different at the marginal significance level (p = 0.097)

