Figure 7.
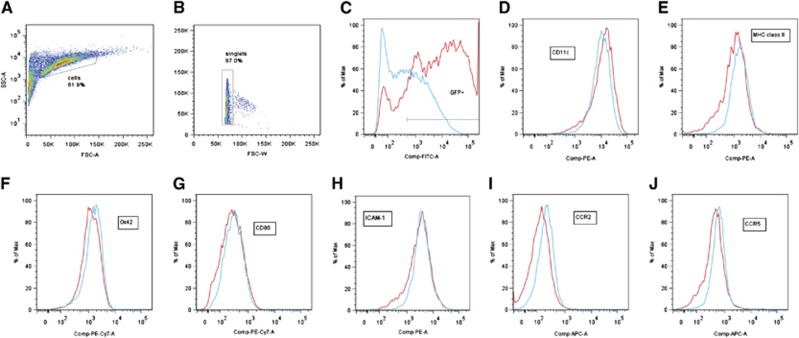
(A–J) Representative flow cytometry for lentiviral (LV)-green fluorescent protein GFP- (red) and LV-sTNFR1-transduced (blue) exDCs. Gating strategy for (A) live dendritic cells (DCs), (B) singlets, and (C) GFP+ transduced population. (D) The percent CD11c+ cells shows slight increase for GFP-ex vivo-derived dendritic cells (exDCs). No difference in (E) MHC class II, (F) Ox42, (G) CD80, or (H) ICAM-1 expression. The percent (I) CCR2+ and (J) CCR5+ cells shows a slight increase for sTNFR1-exDCs.

