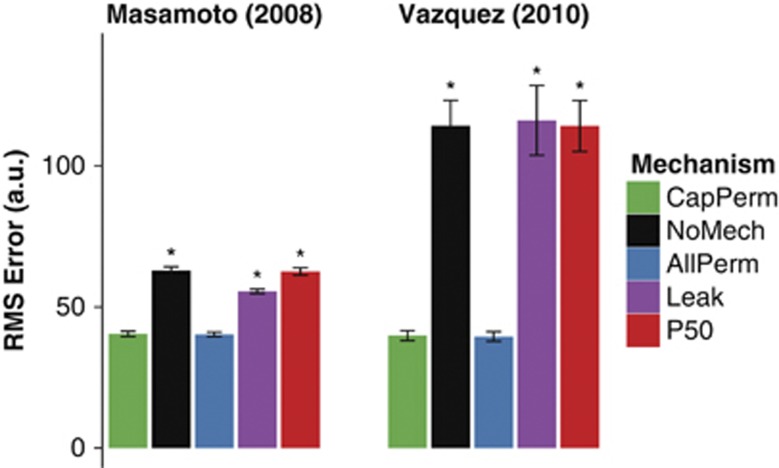
Figure 5.
Root mean square (RMS) error associated with fitting the model to data for all of the mechanisms considered. Data shown as mean±standard error of means (s.e.m.); asterisk (*) indicates P<0.05 versus CapPerm simulations; n=29 simulations for data from Masamoto et al23 and n=35 simulations for data from Vazquez et al.24

